NSDQ Trading Predictions
1 Day Prediction
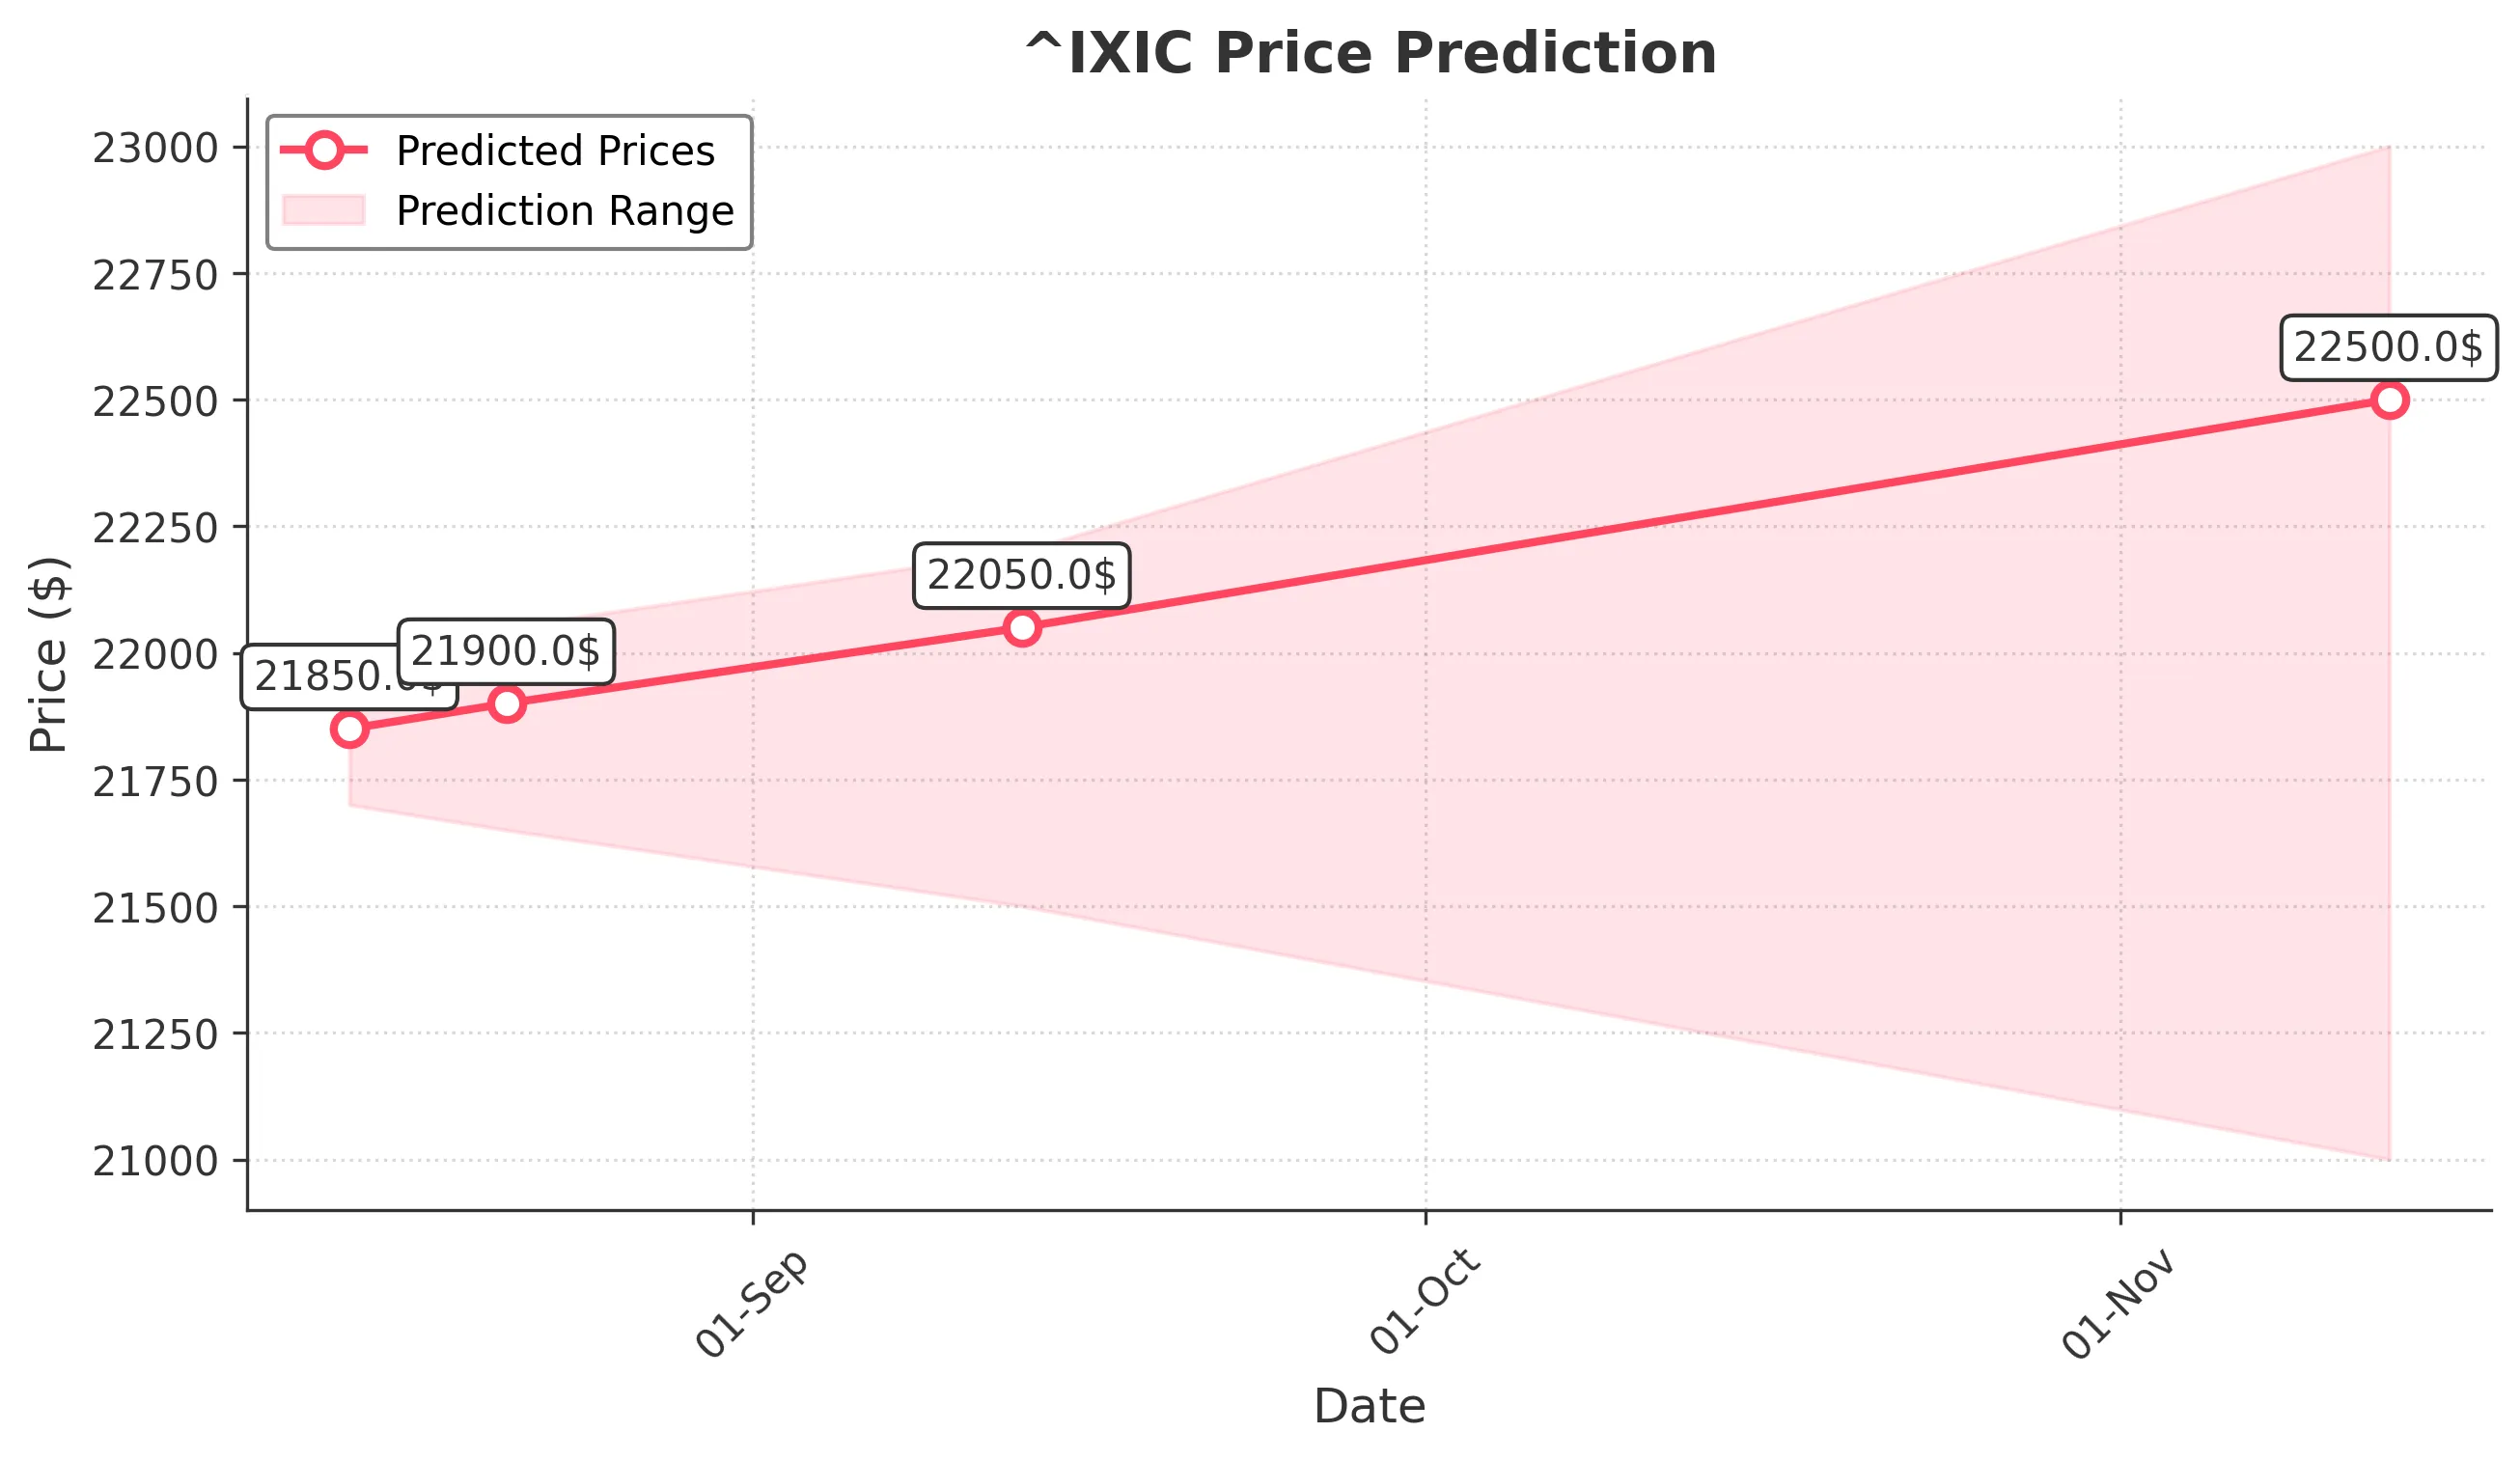
Target: August 14, 2025$21850
$21800
$21950
$21700
Description
The recent bullish momentum, supported by a strong close and positive candlestick patterns, suggests a continuation. RSI is nearing overbought, indicating potential for a pullback, but overall sentiment remains strong.
Analysis
The past 3 months show a bullish trend with significant upward movement. Key support at 21000 and resistance at 22000. RSI indicates strength, but MACD shows divergence. Volume has been consistent, with spikes on bullish days.
Confidence Level
Potential Risks
Potential for a pullback due to overbought conditions and market volatility.
1 Week Prediction
Target: August 21, 2025$21900
$21850
$22050
$21650
Description
The upward trend is expected to continue, with strong support at 21700. However, the RSI indicates overbought conditions, suggesting a possible correction. Market sentiment remains bullish, but caution is advised.
Analysis
The index has shown a strong bullish trend, with significant resistance at 22000. Volume patterns indicate strong buying interest, but the RSI nearing overbought territory raises concerns about potential pullbacks.
Confidence Level
Potential Risks
Market corrections could occur if profit-taking happens, especially with high RSI levels.
1 Month Prediction
Target: September 13, 2025$22050
$21900
$22200
$21500
Description
Continued bullish momentum is expected, with the index likely to test the 22000 resistance level. However, the potential for a correction exists if market sentiment shifts. Watch for volume spikes indicating buying pressure.
Analysis
The index has maintained a bullish trend, with key support at 21500. Technical indicators suggest strength, but the market remains sensitive to external factors. Volume analysis shows healthy buying activity.
Confidence Level
Potential Risks
Unforeseen macroeconomic events or shifts in market sentiment could impact the prediction.
3 Months Prediction
Target: November 13, 2025$22500
$22200
$23000
$21000
Description
If the bullish trend continues, the index could reach 22500, but risks of a market correction remain. External economic factors and earnings reports will play a crucial role in determining market direction.
Analysis
The index has shown a strong upward trajectory, but with increasing volatility. Key resistance at 23000 and support at 21000. Technical indicators suggest a potential for both upward and downward movements, depending on market conditions.
Confidence Level
Potential Risks
High uncertainty due to potential economic downturns or geopolitical events that could affect market stability.