NSDQ Trading Predictions
1 Day Prediction
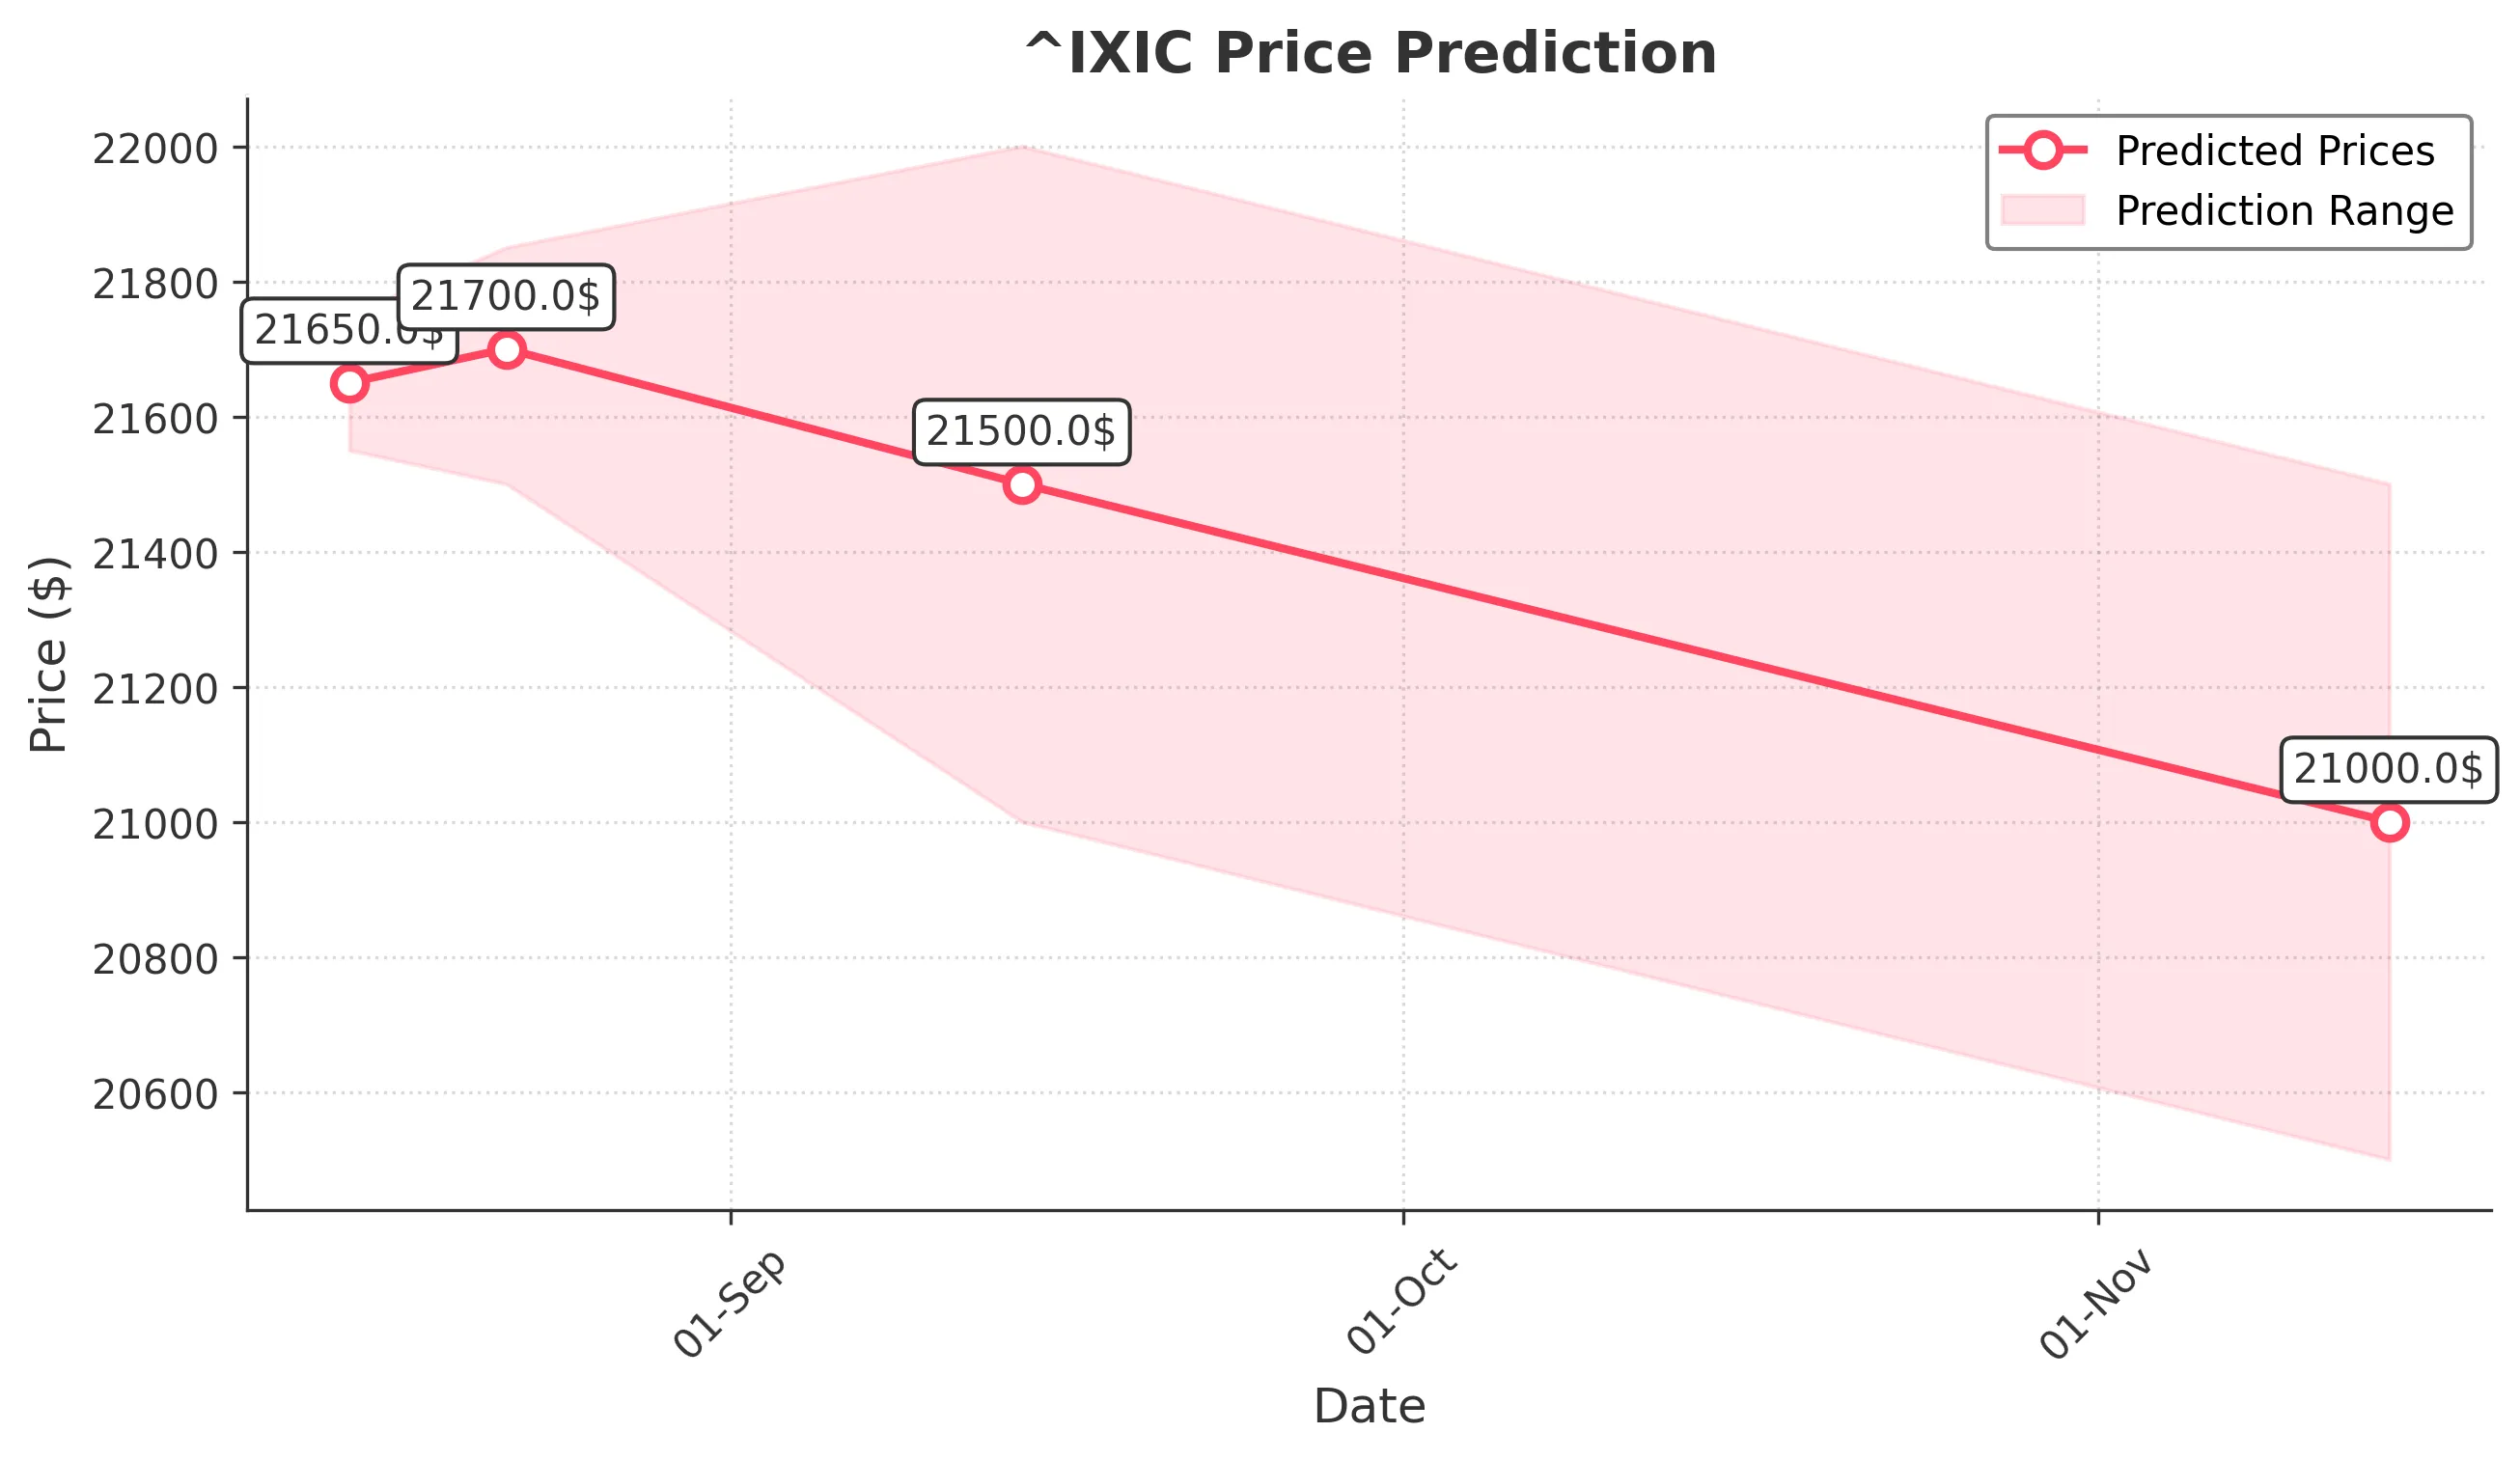
Target: August 15, 2025$21650
$21600
$21750
$21550
Description
The market shows bullish momentum with a recent upward trend. The RSI is nearing overbought levels, indicating potential for a pullback. However, strong support at 21500 may hold. Volume remains steady, suggesting continued interest.
Analysis
The past 3 months show a bullish trend with significant upward movement. Key support at 21500 and resistance at 21800. The MACD indicates bullish momentum, while the ATR suggests moderate volatility. Volume patterns are stable, with no significant spikes.
Confidence Level
Potential Risks
Potential for a reversal exists if market sentiment shifts or if macroeconomic news impacts investor confidence.
1 Week Prediction
Target: August 22, 2025$21700
$21650
$21850
$21500
Description
The bullish trend is expected to continue, supported by recent highs. However, the RSI indicates overbought conditions, which may lead to a short-term pullback. Volume is expected to remain strong, supporting upward movement.
Analysis
The stock has shown consistent upward movement, with key resistance at 21800. The MACD remains positive, indicating bullish momentum. Volume patterns suggest healthy trading activity, but caution is advised due to potential overbought conditions.
Confidence Level
Potential Risks
Market volatility and external economic factors could lead to unexpected price movements.
1 Month Prediction
Target: September 14, 2025$21500
$21600
$22000
$21000
Description
Expect a potential pullback as the market may correct from overbought levels. Support at 21000 is critical. If maintained, a rebound could occur, but bearish sentiment may prevail if economic indicators worsen.
Analysis
The stock has been in a bullish phase, but signs of exhaustion are emerging. Key support at 21000 and resistance at 22000. The RSI is high, indicating potential for a correction. Volume has been consistent, but any spikes could signal reversals.
Confidence Level
Potential Risks
Economic data releases and geopolitical events could significantly impact market direction.
3 Months Prediction
Target: November 14, 2025$21000
$21100
$21500
$20500
Description
A bearish outlook is anticipated as the market may face headwinds from economic uncertainties. Key support at 20500 could be tested. If broken, further declines are likely. Watch for volume spikes indicating panic selling.
Analysis
The stock has shown signs of weakening momentum. Key support at 20500 is crucial, with resistance at 21500. The MACD is flattening, indicating potential bearish divergence. Volume patterns suggest caution, as any significant drops could trigger further selling.
Confidence Level
Potential Risks
Unforeseen economic events or shifts in market sentiment could lead to volatility and impact predictions.