NVDA Trading Predictions
1 Day Prediction
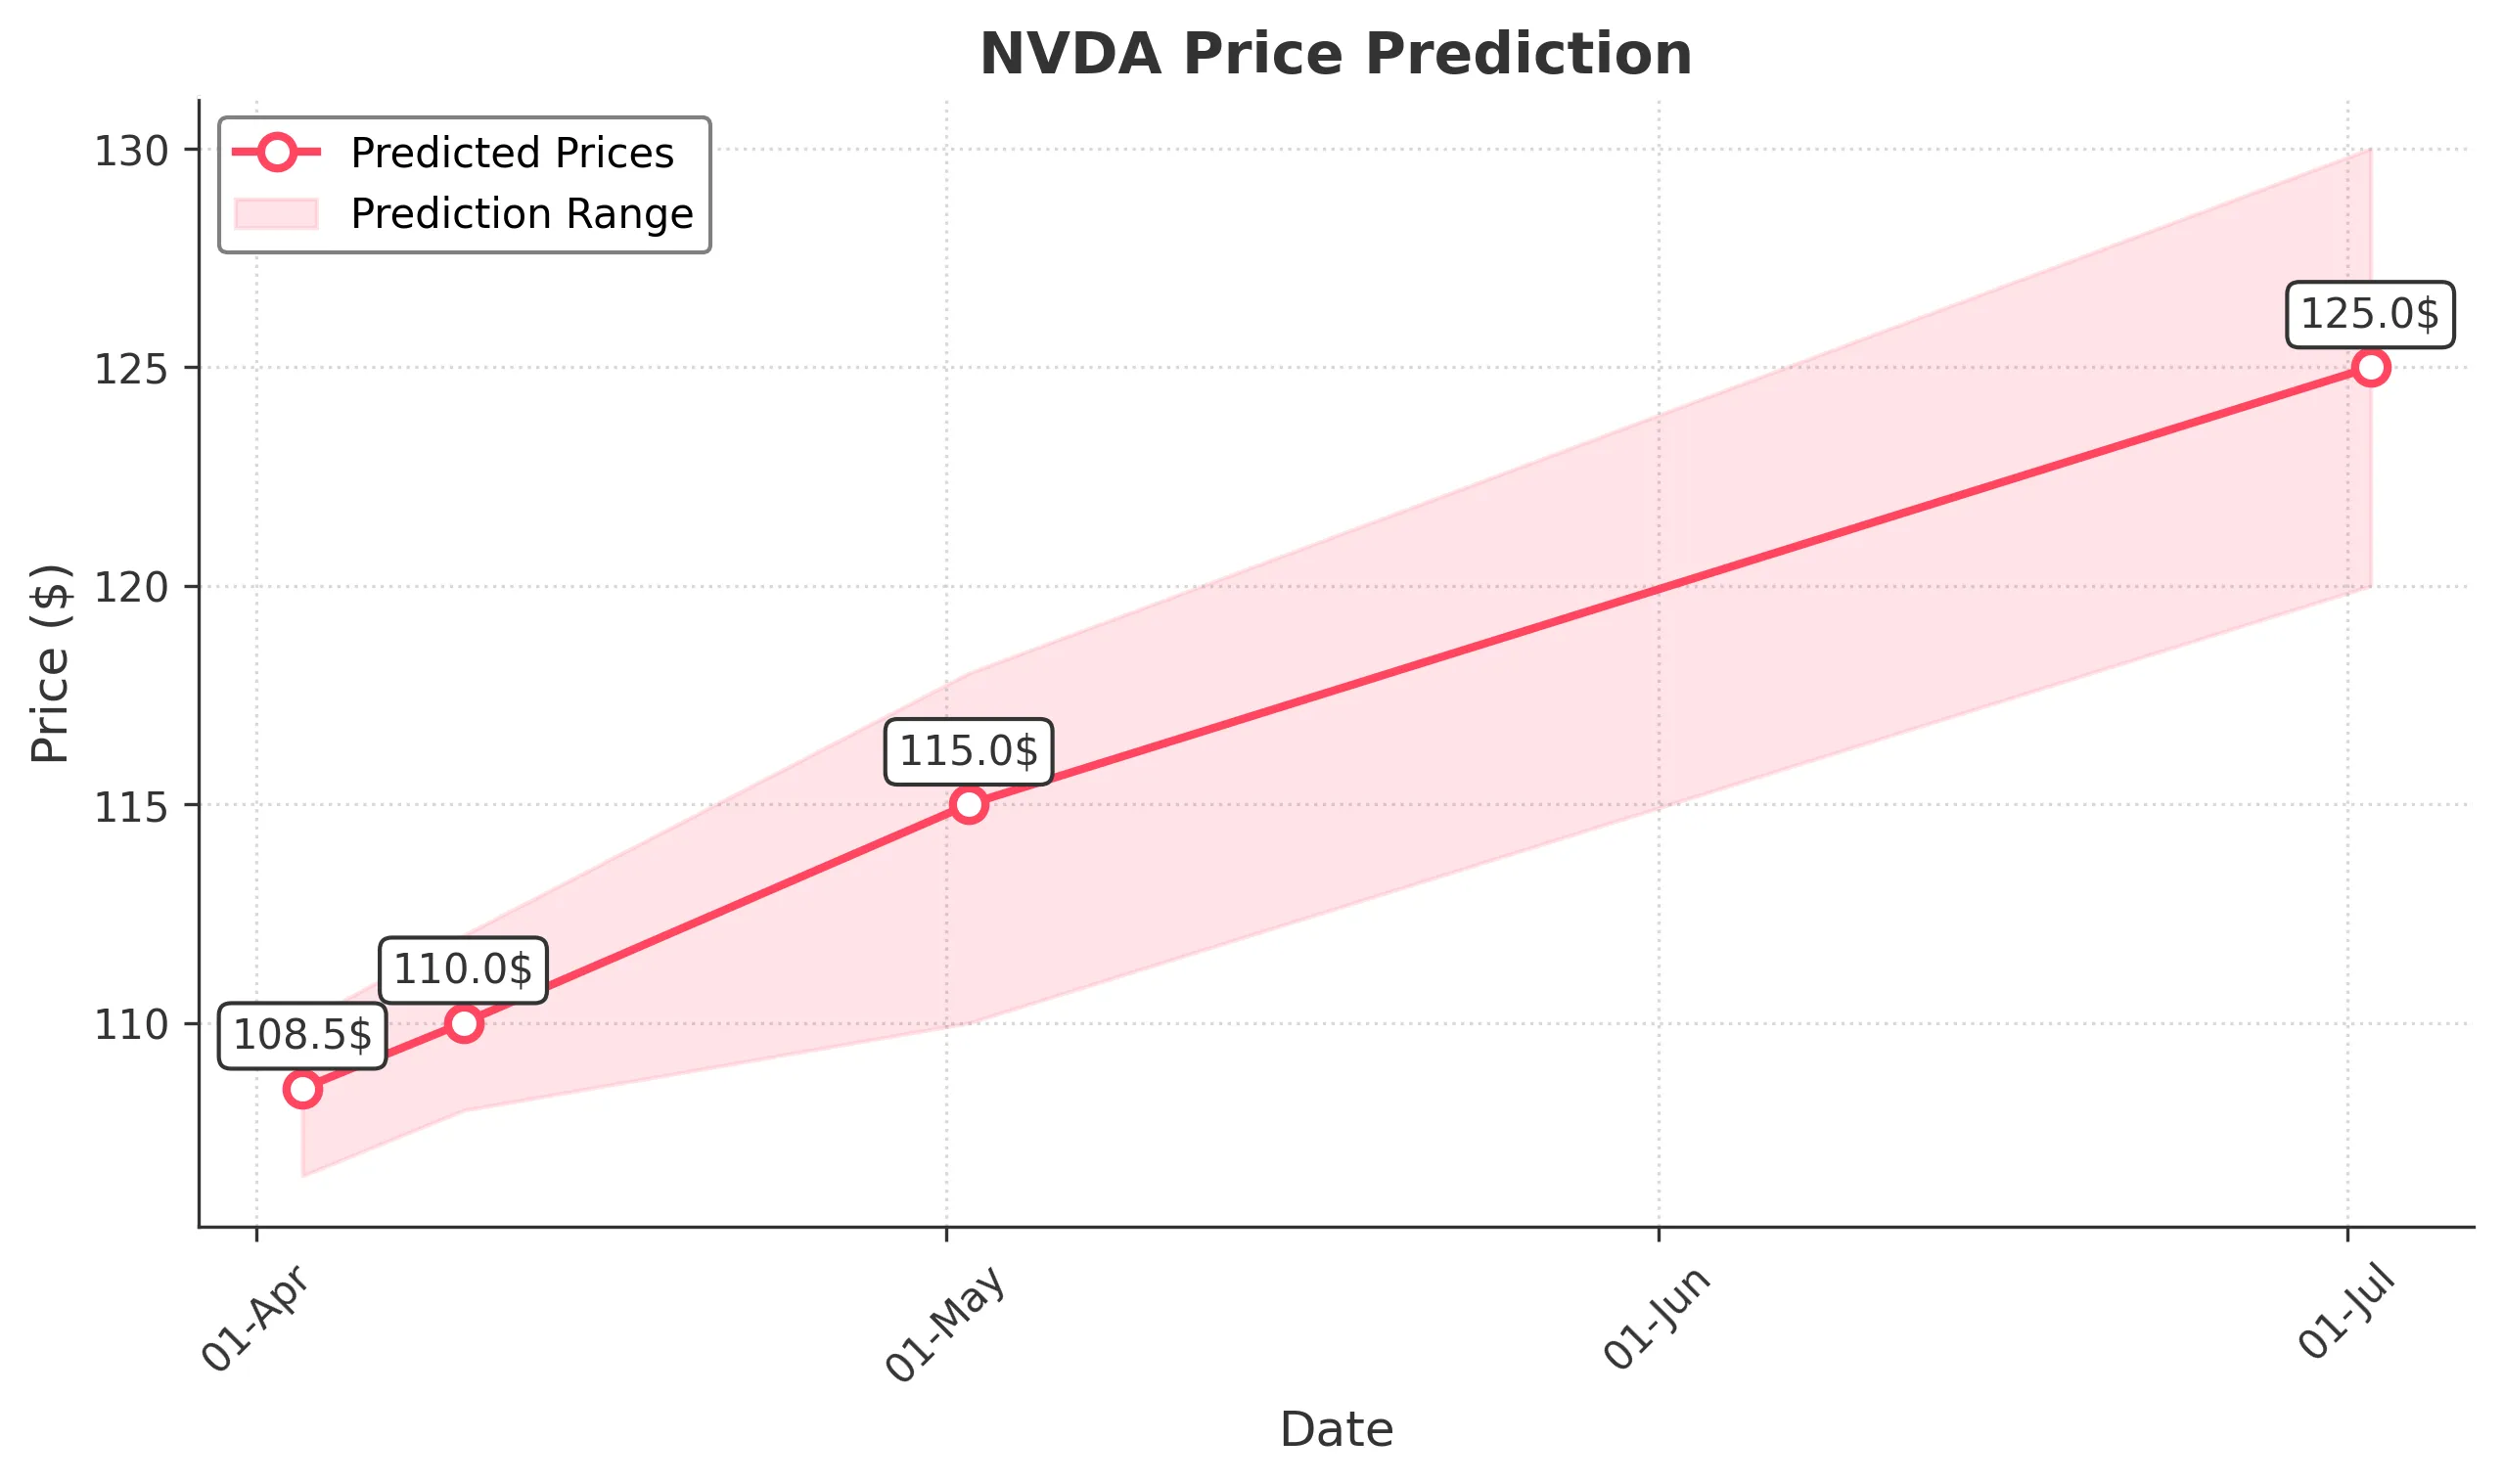
Target: April 3, 2025$108.5
$107.8
$110
$106.5
Description
The stock shows a slight bullish trend with a potential bounce from recent lows. RSI indicates oversold conditions, while MACD is showing a bullish crossover. However, volatility remains high, suggesting caution.
Analysis
Over the past 3 months, NVDA has experienced significant volatility, with a bearish trend recently. Key support is around $106, while resistance is near $120. Volume spikes indicate potential reversals, but overall sentiment remains cautious.
Confidence Level
Potential Risks
Market sentiment could shift due to macroeconomic news or earnings reports, which may impact the prediction.
1 Week Prediction
Target: April 10, 2025$110
$109.5
$112
$108
Description
A potential recovery is indicated as the stock approaches key support levels. The MACD shows bullish momentum, and the RSI is improving. However, external factors could still lead to volatility.
Analysis
The stock has been in a bearish phase, but recent price action suggests a possible reversal. Key support at $106 and resistance at $120 remain critical. Volume analysis shows increased activity, indicating potential interest from buyers.
Confidence Level
Potential Risks
Unforeseen market events or earnings surprises could lead to unexpected price movements.
1 Month Prediction
Target: May 2, 2025$115
$112
$118
$110
Description
If the bullish momentum continues, NVDA could see a gradual recovery. The RSI is expected to stabilize, and MACD may confirm a bullish trend. However, macroeconomic factors could introduce volatility.
Analysis
The stock has shown a bearish trend recently, with significant support at $106. The potential for recovery exists, but market sentiment remains mixed. Technical indicators suggest caution, and volume patterns indicate uncertainty.
Confidence Level
Potential Risks
Economic indicators and earnings reports could significantly impact stock performance, leading to potential downward pressure.
3 Months Prediction
Target: July 2, 2025$125
$122
$130
$120
Description
If the market stabilizes and positive sentiment returns, NVDA could recover towards $125. The technical indicators suggest a potential bullish reversal, but external factors remain a risk.
Analysis
The stock has faced significant challenges, with a bearish trend dominating. Key resistance levels are at $120, while support is at $106. The outlook remains cautious, with potential for recovery if market conditions improve.
Confidence Level
Potential Risks
Long-term predictions are uncertain due to potential market volatility and economic conditions that could affect investor sentiment.