NVDA Trading Predictions
1 Day Prediction
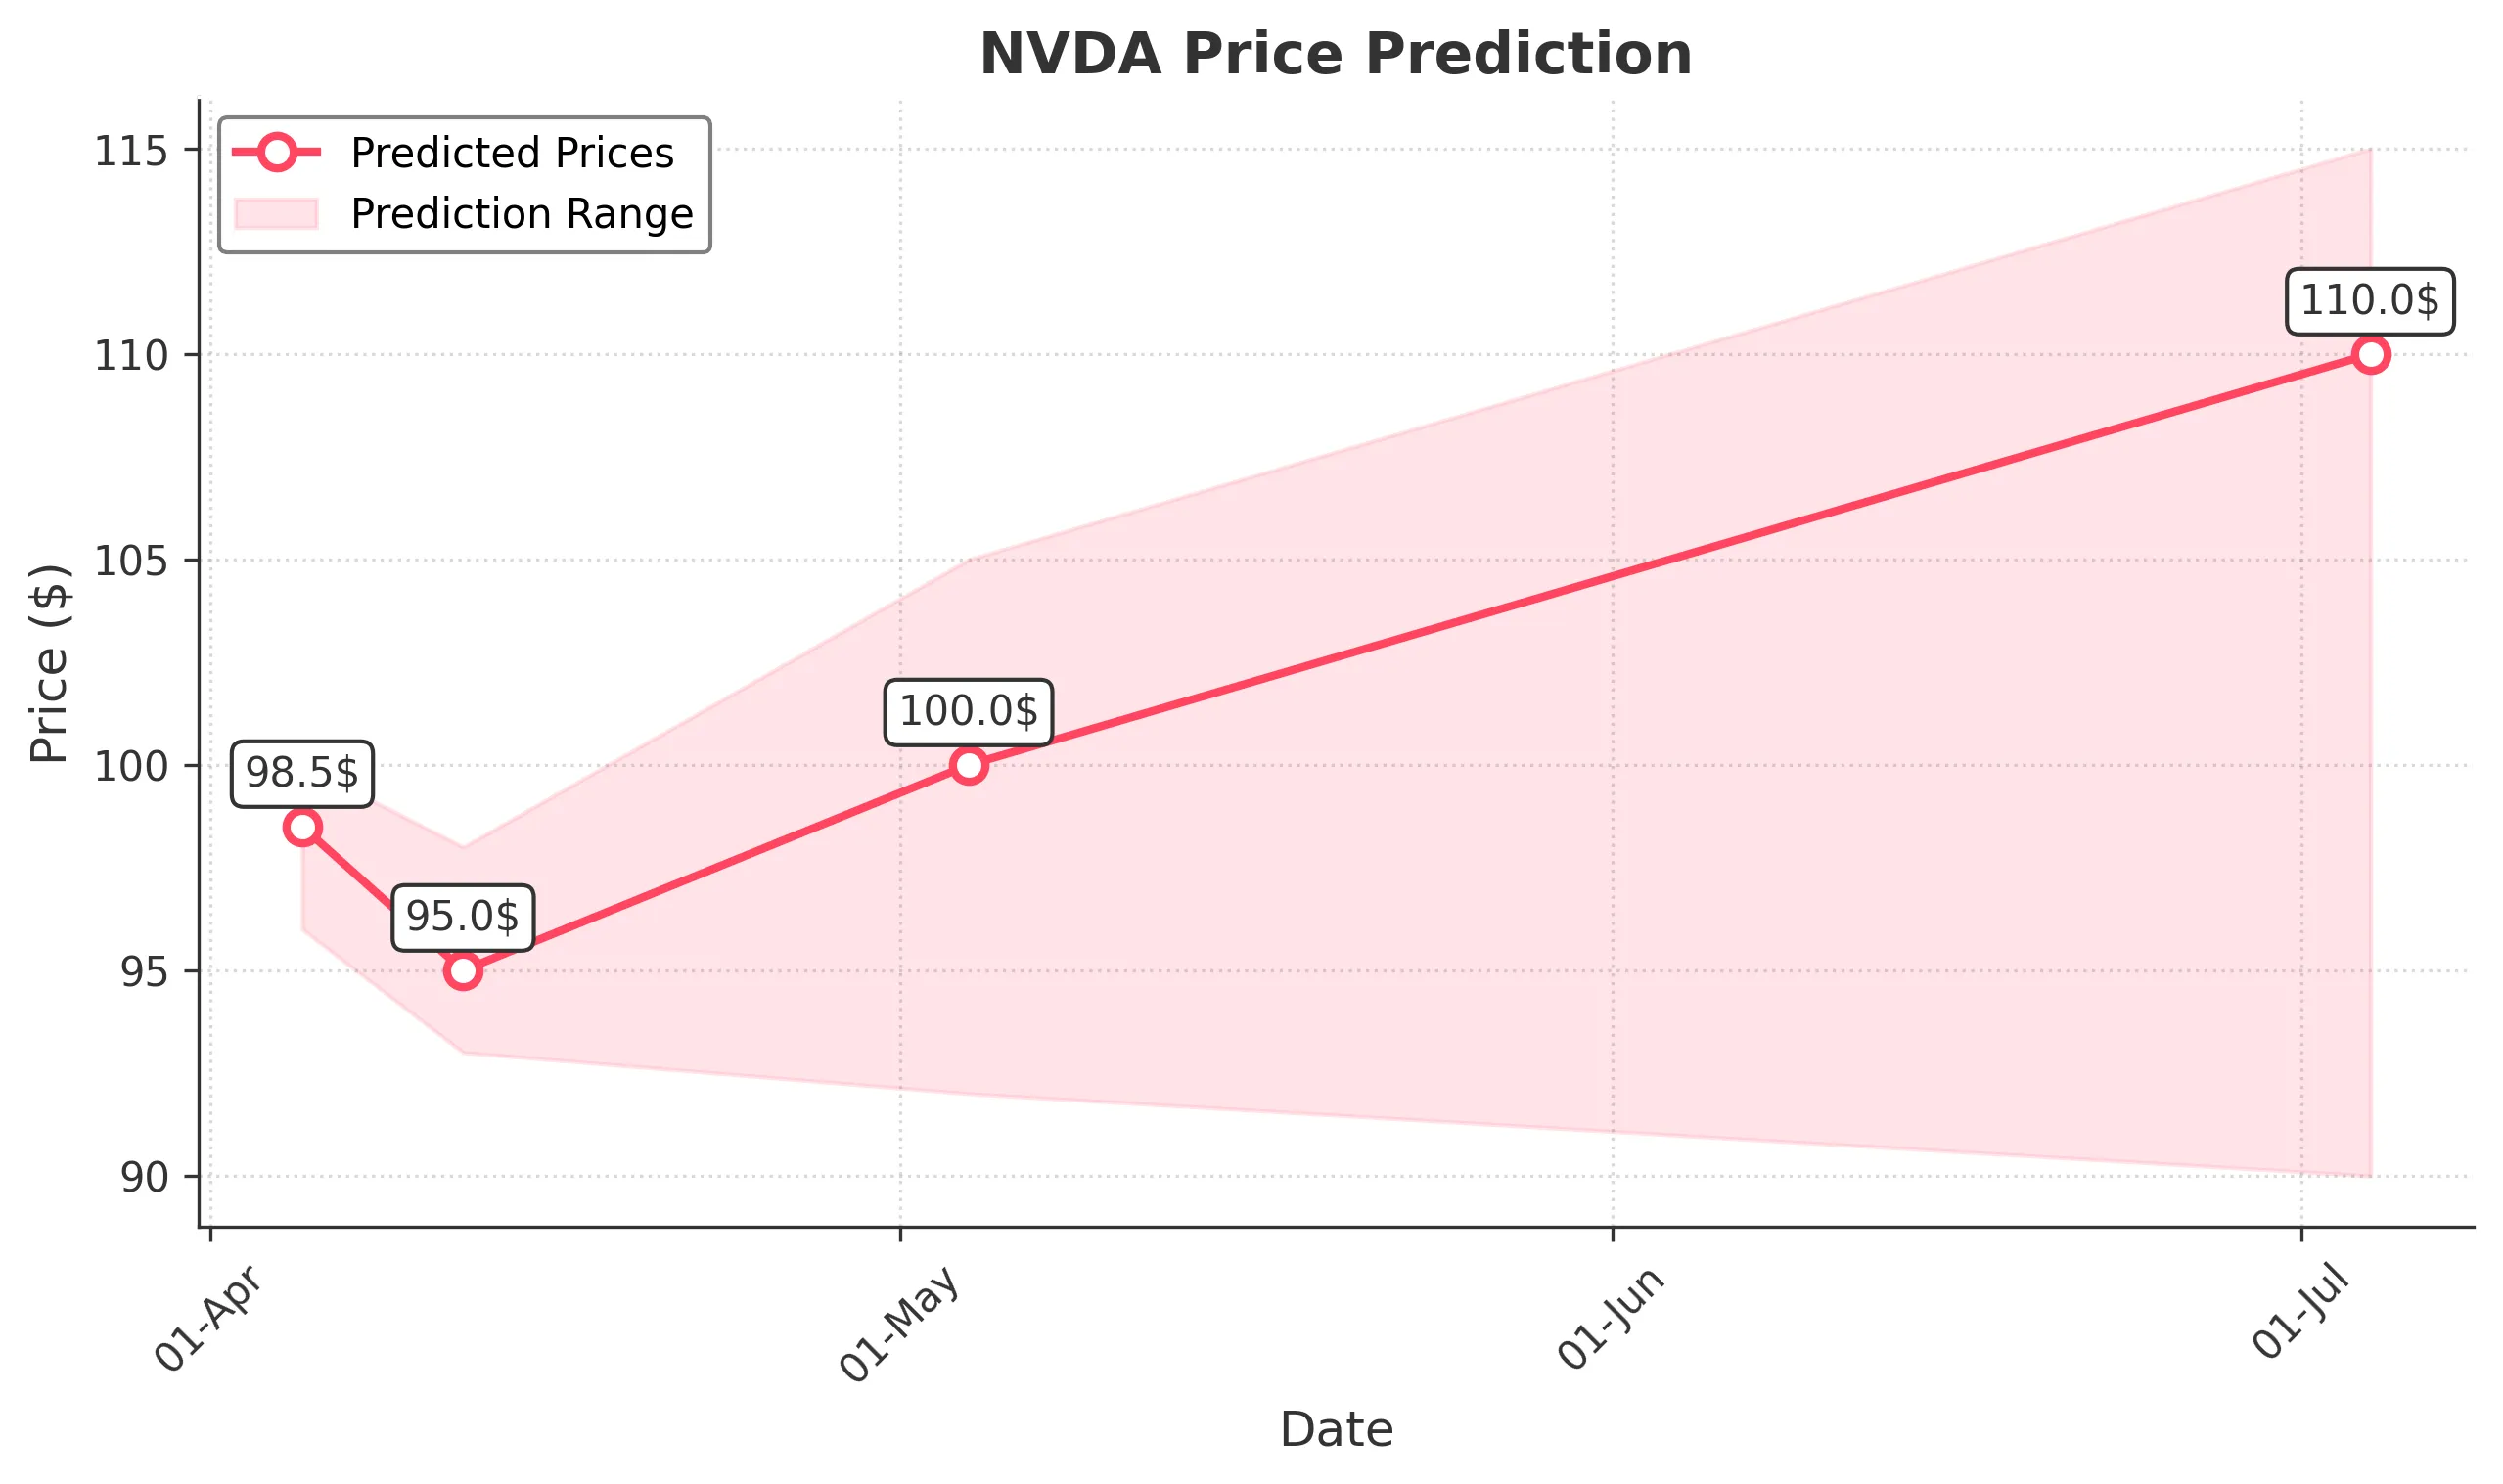
Target: April 5, 2025$98.5
$98
$100
$96
Description
The stock shows bearish momentum with a recent downtrend. The RSI indicates oversold conditions, but a potential bounce could occur. However, the MACD is bearish, suggesting continued weakness. Volume remains high, indicating strong selling pressure.
Analysis
Over the past 3 months, NVDA has experienced significant volatility, with a bearish trend evident since late January. Key support is around $97, while resistance is near $110. The MACD and RSI indicate bearish momentum, and recent volume spikes suggest strong selling pressure.
Confidence Level
Potential Risks
Market volatility and potential news could impact the stock's performance. A reversal is possible if bullish sentiment returns.
1 Week Prediction
Target: April 12, 2025$95
$96
$98
$93
Description
The bearish trend is expected to continue, with potential for further declines. The Bollinger Bands indicate a squeeze, suggesting volatility ahead. The MACD remains negative, and the RSI is approaching oversold levels, indicating potential for a short-term bounce.
Analysis
The stock has been in a downtrend, with significant support at $95. The recent high volume indicates strong selling pressure. Technical indicators suggest continued bearish momentum, but oversold conditions may lead to a short-term bounce.
Confidence Level
Potential Risks
Unforeseen macroeconomic events or earnings reports could lead to unexpected price movements. A reversal could occur if bullish sentiment emerges.
1 Month Prediction
Target: May 4, 2025$100
$95
$105
$92
Description
A potential recovery may occur as the stock approaches key support levels. The RSI may indicate oversold conditions, and a bullish divergence could form. However, the overall trend remains bearish, and caution is advised.
Analysis
The stock has shown a bearish trend, with significant support at $95. The potential for a recovery exists, but the overall sentiment remains cautious. Technical indicators suggest a possible bounce, but the bearish trend is still dominant.
Confidence Level
Potential Risks
Market sentiment and external factors could significantly impact the stock's recovery. A lack of positive catalysts may hinder upward movement.
3 Months Prediction
Target: July 4, 2025$110
$100
$115
$90
Description
If the stock can stabilize and break above resistance levels, a recovery to $110 is possible. The MACD may turn bullish, and the RSI could indicate a reversal. However, the overall market conditions will play a crucial role.
Analysis
The stock has been in a bearish trend, but potential exists for recovery if key resistance levels are broken. The market sentiment and external factors will heavily influence the stock's performance in the coming months.
Confidence Level
Potential Risks
Long-term predictions are uncertain due to potential macroeconomic changes and market sentiment shifts. A bearish trend could persist if no positive catalysts emerge.