NVDA Trading Predictions
1 Day Prediction
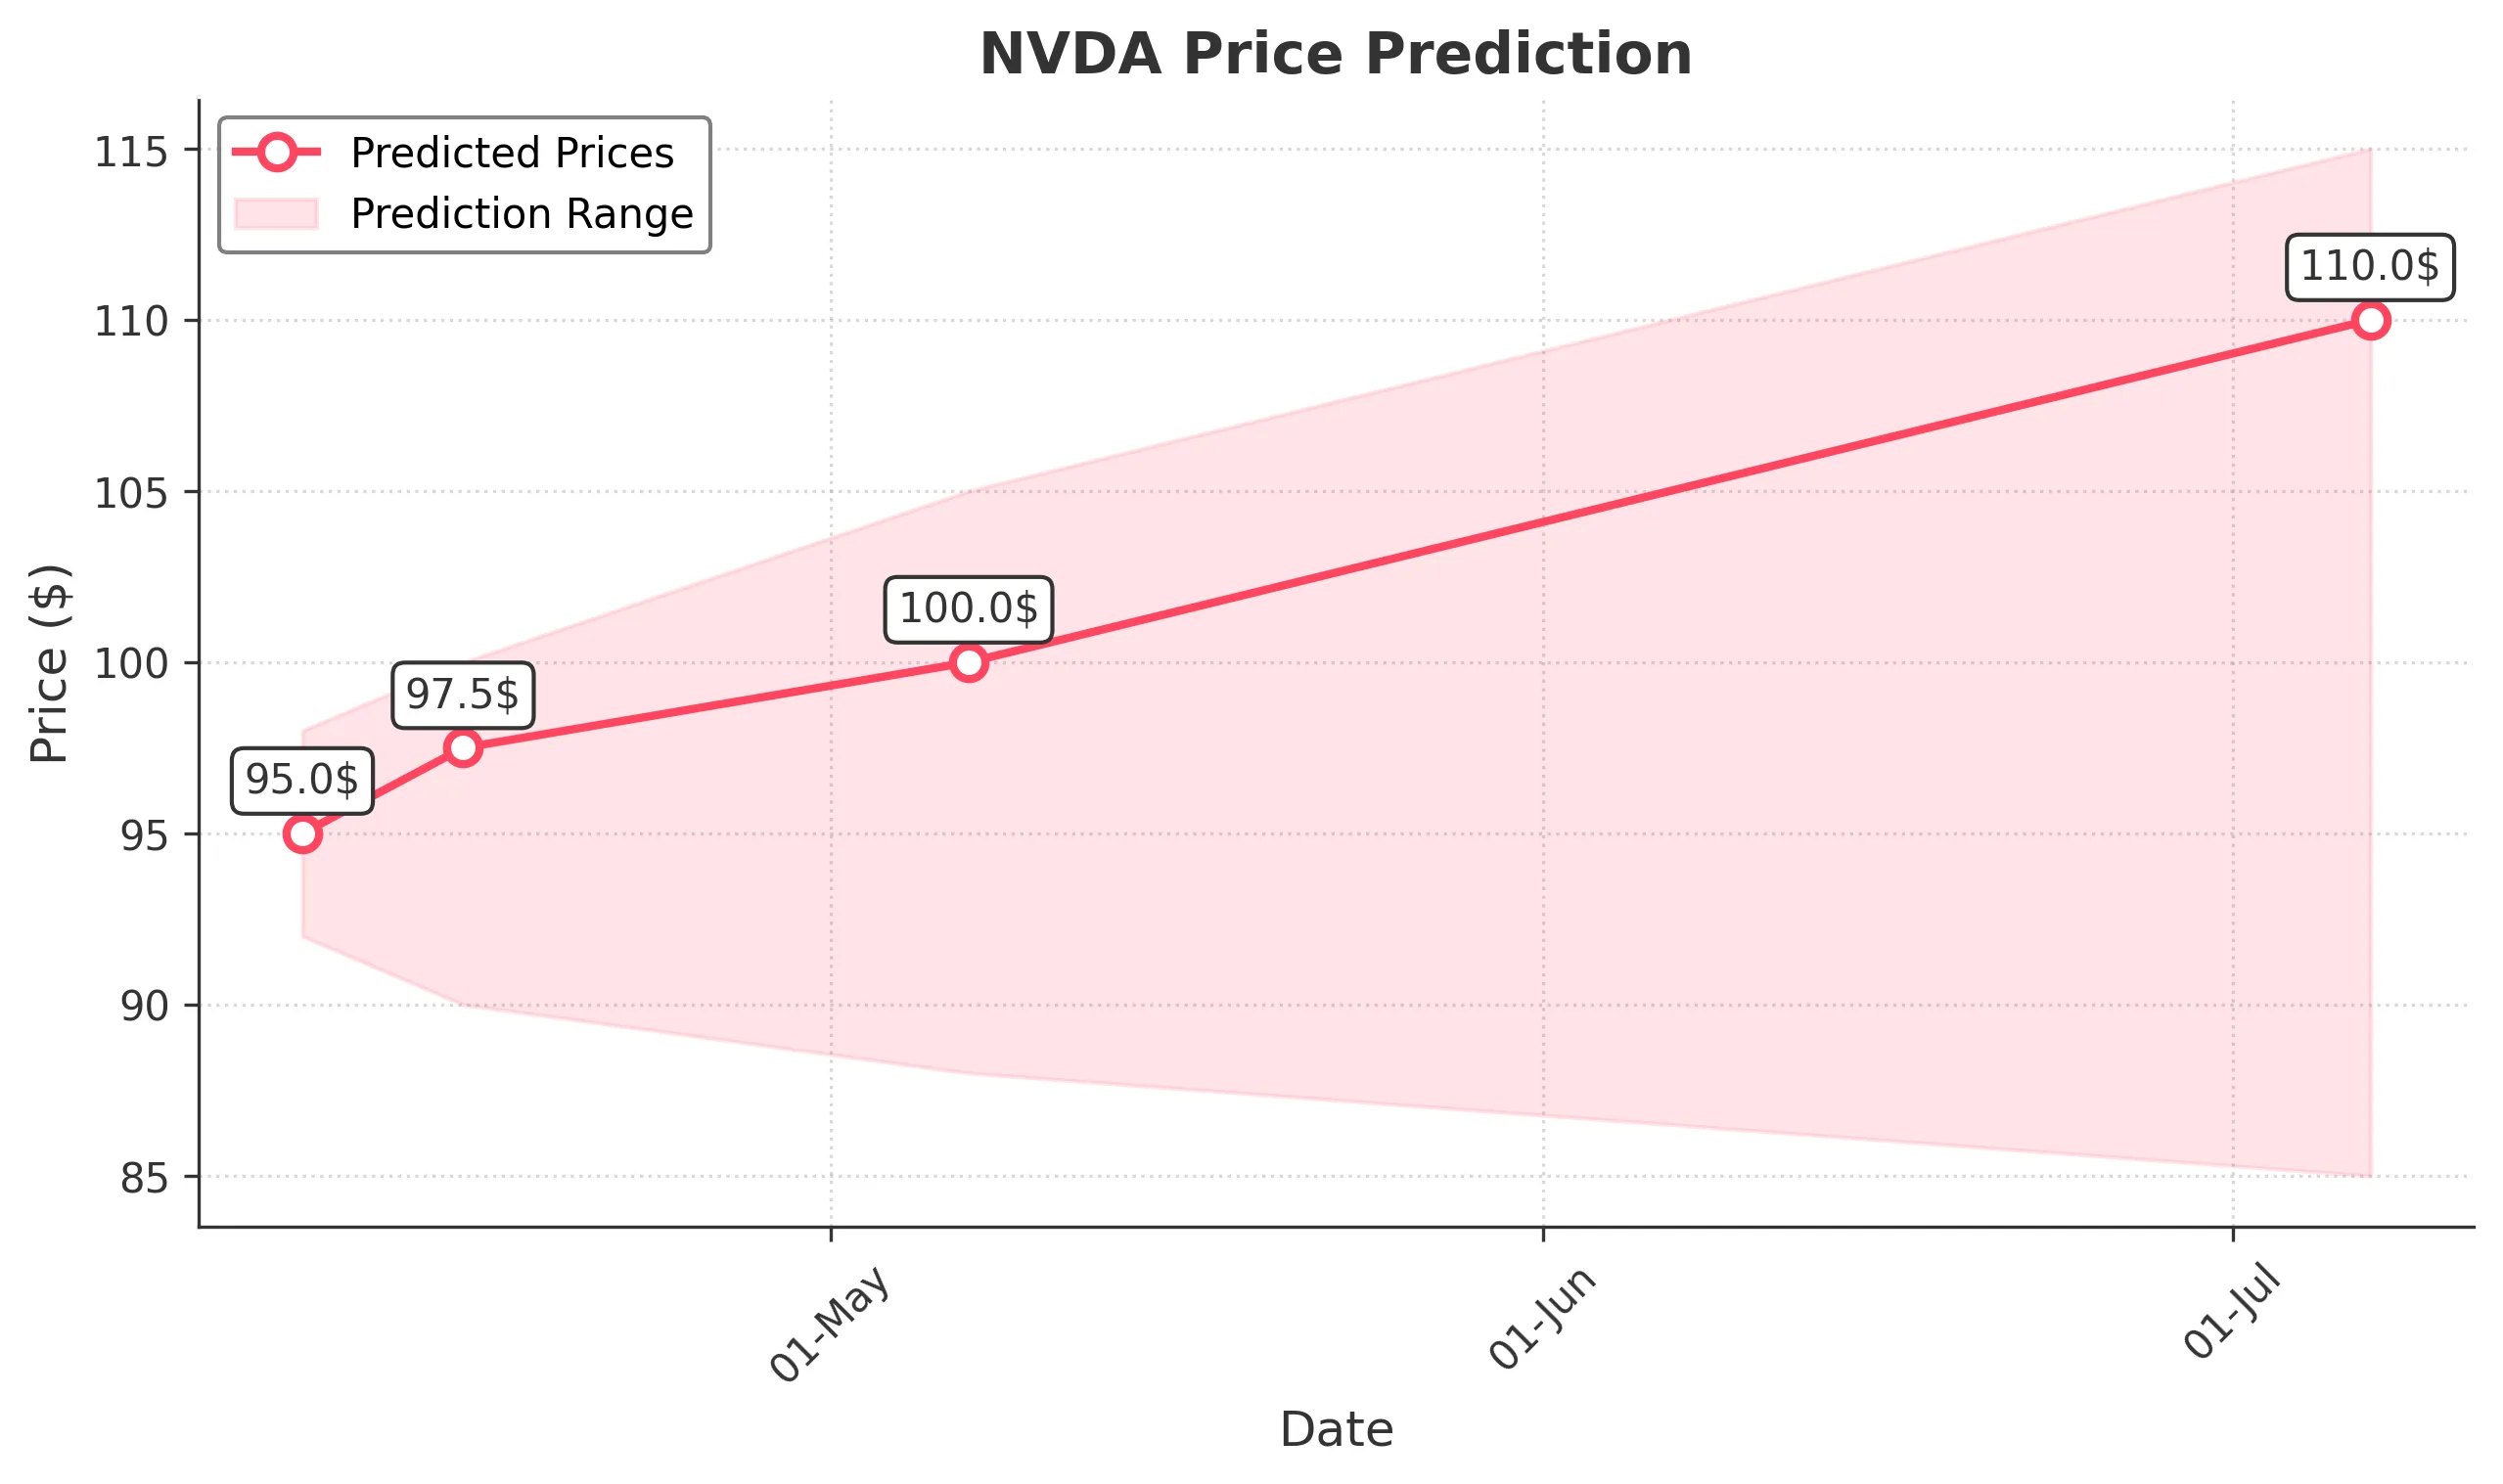
Target: April 8, 2025$95
$94.5
$98
$92
Description
Given the recent downtrend and high volatility, the prediction reflects a slight recovery. The RSI is nearing oversold levels, suggesting a potential bounce. However, bearish sentiment persists due to recent price action.
Analysis
Over the past 3 months, NVDA has shown a bearish trend, with significant support around $94. Recent volume spikes indicate panic selling. Technical indicators like MACD and RSI suggest potential reversals, but overall sentiment remains cautious.
Confidence Level
Potential Risks
Market sentiment remains weak, and any negative news could lead to further declines.
1 Week Prediction
Target: April 15, 2025$97.5
$95
$100
$90
Description
The prediction anticipates a slight recovery as the stock may find support at $94. The RSI is improving, indicating potential upward momentum, but caution is warranted due to overall market conditions.
Analysis
The stock has faced significant selling pressure, with key support at $94. Technical indicators show mixed signals, with potential for a short-term bounce. However, external factors like market volatility could impact performance.
Confidence Level
Potential Risks
Continued bearish sentiment and macroeconomic factors could hinder recovery.
1 Month Prediction
Target: May 7, 2025$100
$98
$105
$88
Description
A gradual recovery is expected as the stock stabilizes. The potential for a bullish reversal exists if it can break above $100. However, macroeconomic uncertainties may limit upside potential.
Analysis
The stock has been in a bearish phase, with significant resistance at $100. Technical indicators suggest a potential reversal, but the overall market sentiment remains cautious. Volume patterns indicate uncertainty.
Confidence Level
Potential Risks
Market volatility and external economic factors could lead to unexpected price movements.
3 Months Prediction
Target: July 7, 2025$110
$105
$115
$85
Description
Assuming a recovery trend, the stock may reach $110 if it can maintain upward momentum. However, external economic pressures could lead to volatility.
Analysis
The stock has shown a bearish trend with significant support at $94. While there are signs of potential recovery, the overall market sentiment remains bearish. Key resistance levels will need to be monitored closely.
Confidence Level
Potential Risks
Long-term predictions are uncertain due to potential market shifts and economic conditions.