NVDA Trading Predictions
1 Day Prediction
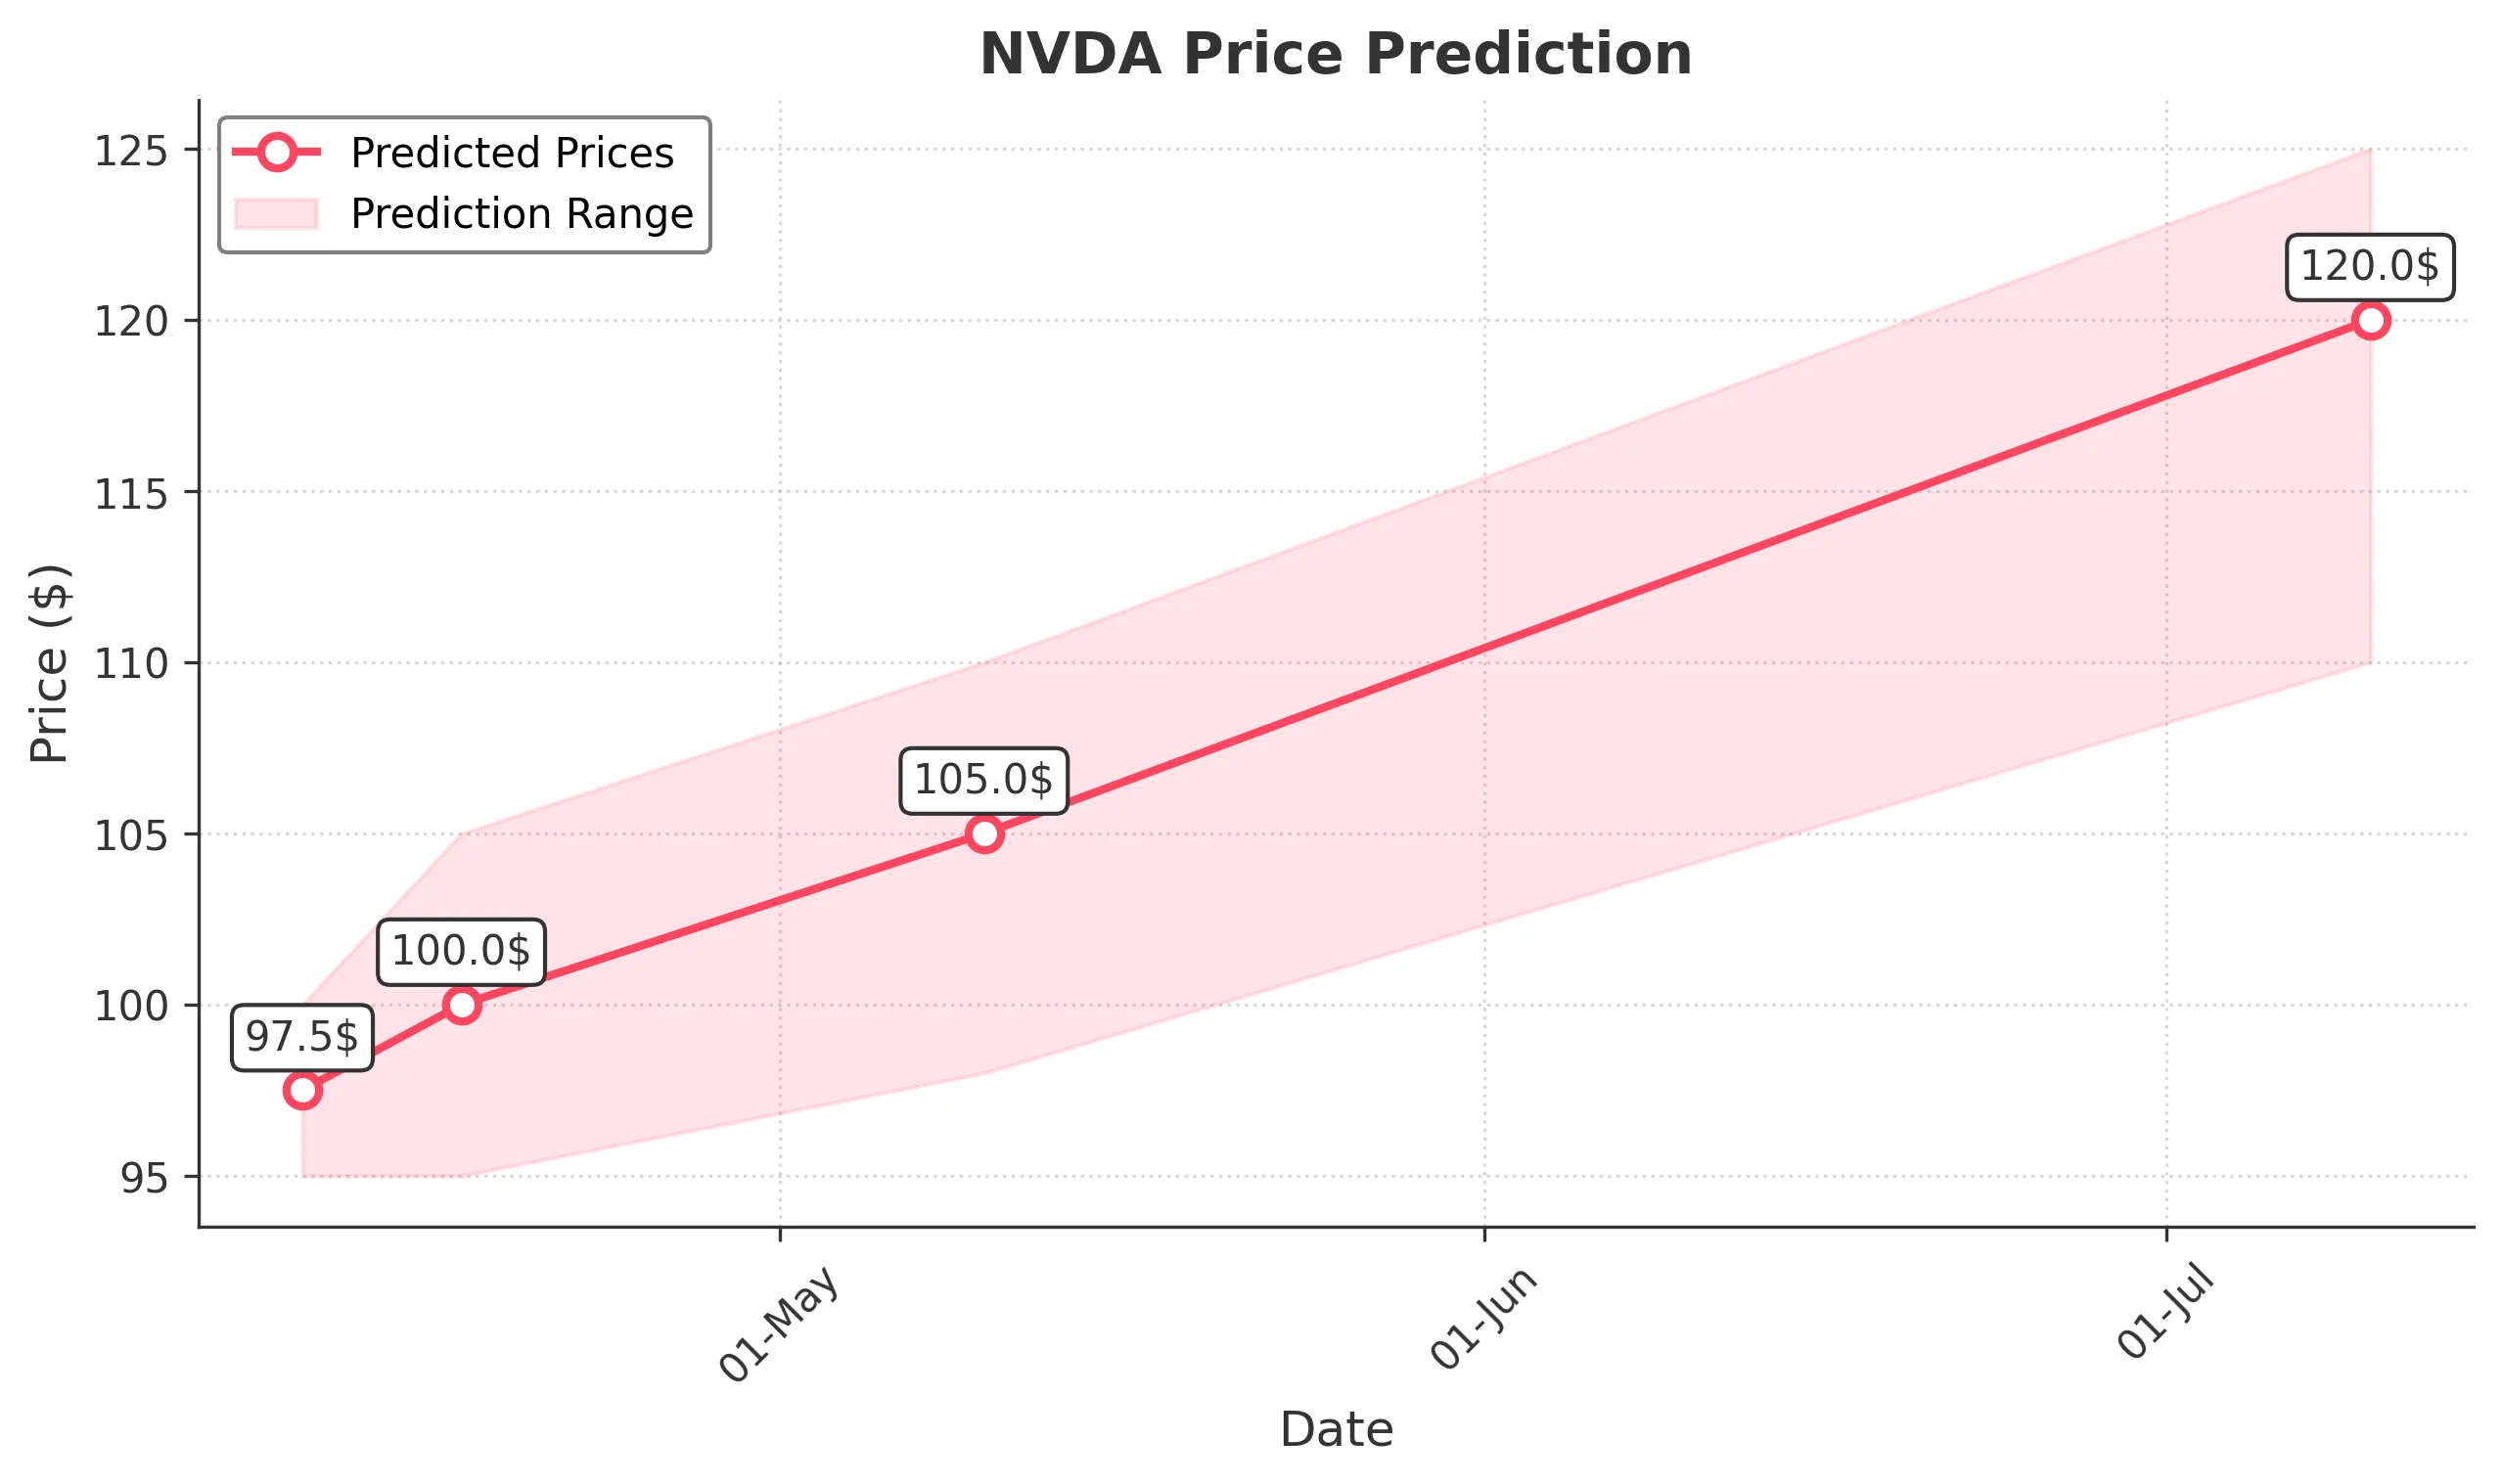
Target: April 10, 2025$97.5
$96.5
$100
$95
Description
The stock shows signs of short-term recovery after recent declines. RSI indicates oversold conditions, suggesting a potential bounce. However, volatility remains high, and market sentiment is cautious due to recent price drops.
Analysis
Over the past 3 months, NVDA has experienced significant volatility, with a bearish trend recently. Key support at $94.30 has been tested. RSI indicates oversold conditions, while MACD shows a potential bullish crossover. Volume spikes during declines suggest strong selling pressure.
Confidence Level
Potential Risks
Market volatility and potential negative news could impact the prediction. A reversal is possible if selling pressure continues.
1 Week Prediction
Target: April 17, 2025$100
$98
$105
$95
Description
A potential recovery is anticipated as the stock may find support around $94.30. The MACD is showing signs of bullish momentum, and a rebound could occur if market sentiment improves.
Analysis
The stock has been in a bearish phase, with significant price drops. Support at $94.30 is critical. The RSI is recovering, indicating potential for upward movement. However, the overall market sentiment remains cautious.
Confidence Level
Potential Risks
Continued bearish sentiment or macroeconomic factors could hinder recovery. Watch for volume trends and external news.
1 Month Prediction
Target: May 10, 2025$105
$102
$110
$98
Description
If the stock maintains upward momentum, it could reach $105. The MACD suggests a bullish trend, but external factors could impact performance. Watch for resistance at $110.
Analysis
The stock has shown significant volatility, with a bearish trend recently. Key resistance at $110 may limit upward movement. The RSI is improving, but overall market sentiment remains uncertain.
Confidence Level
Potential Risks
Market volatility and potential negative news could affect the prediction. A bearish reversal is still a possibility.
3 Months Prediction
Target: July 10, 2025$120
$115
$125
$110
Description
If the stock can stabilize and build on recent gains, it may reach $120. The MACD indicates potential bullish momentum, but external factors could still pose risks.
Analysis
The stock has been in a bearish trend, with significant price fluctuations. Key resistance levels are at $125. The RSI is improving, but overall market sentiment remains cautious. External factors could heavily influence future performance.
Confidence Level
Potential Risks
Unforeseen macroeconomic events or continued bearish sentiment could derail the recovery. Watch for changes in volume and market sentiment.