NVDA Trading Predictions
1 Day Prediction
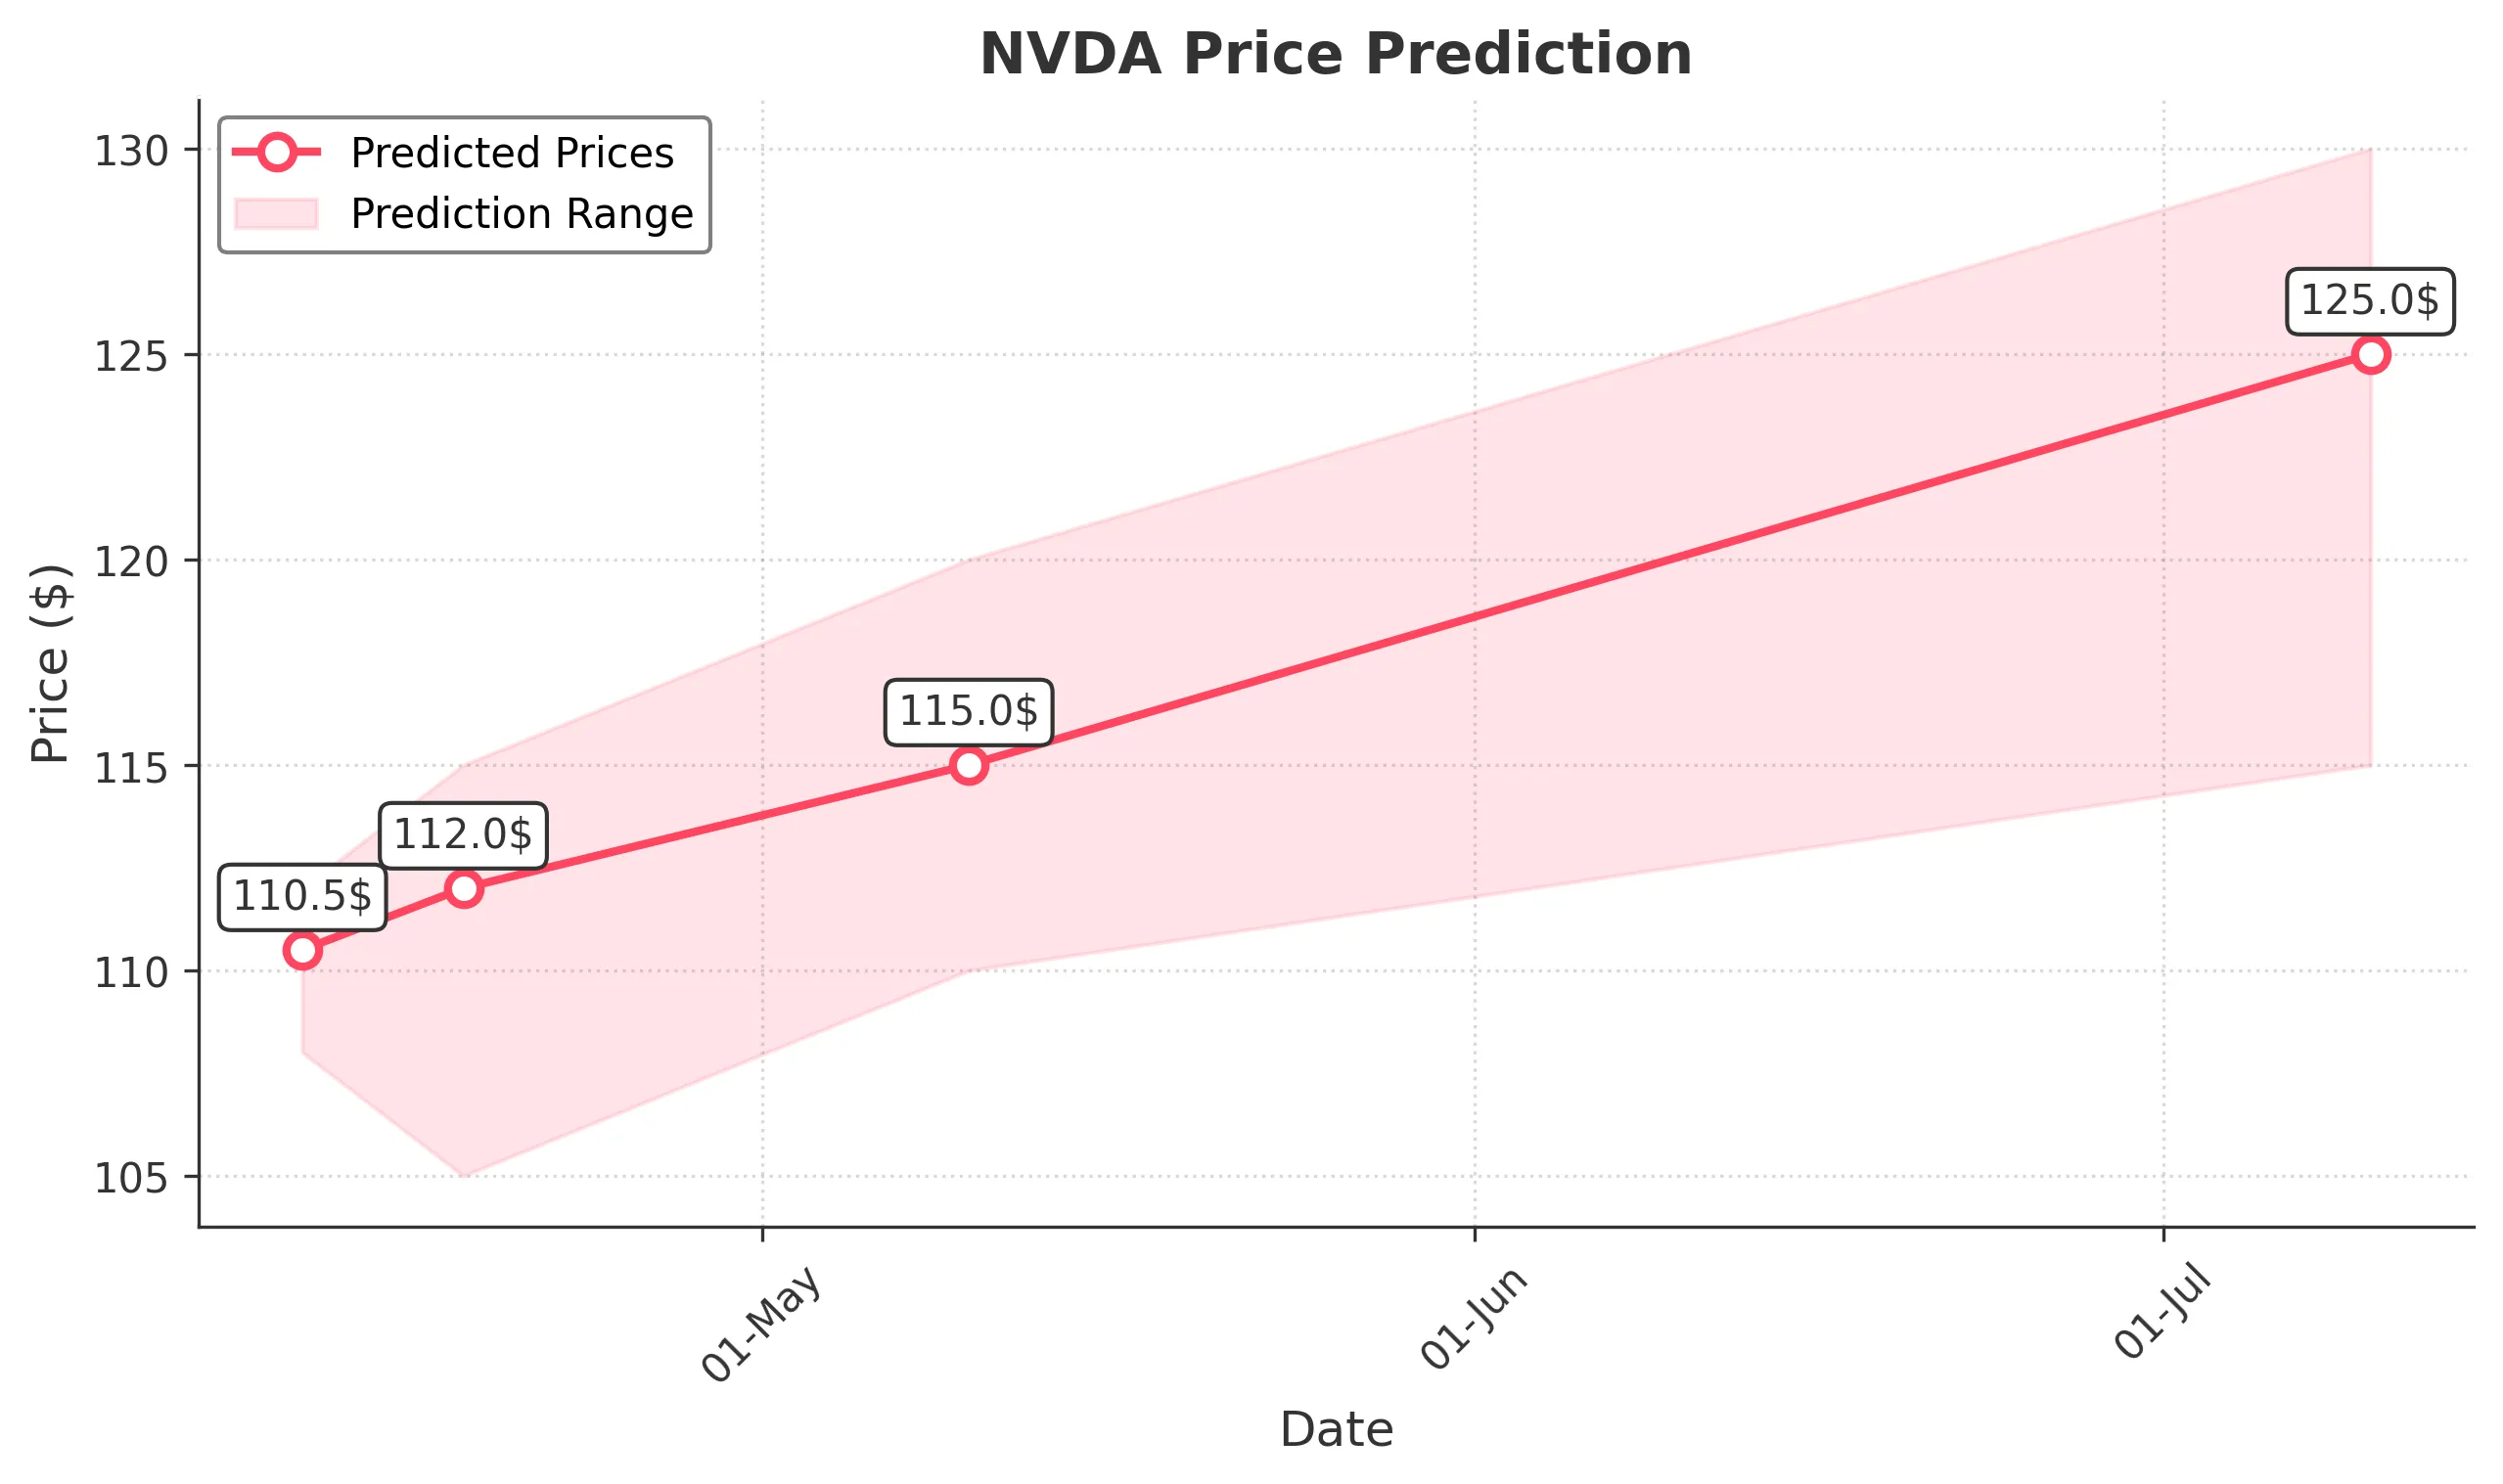
Target: April 11, 2025$110.5
$109.5
$112
$108
Description
The stock shows signs of stabilization after recent volatility. The RSI is near neutral, indicating potential for a slight rebound. However, the MACD is bearish, suggesting caution. Volume remains elevated, indicating strong interest.
Analysis
Over the past 3 months, NVDA has experienced significant volatility, with a bearish trend recently. Key support is around $100, while resistance is near $140. The MACD indicates bearish momentum, while volume spikes suggest strong trading interest.
Confidence Level
Potential Risks
Market sentiment could shift rapidly due to macroeconomic news or earnings reports, which may impact the prediction.
1 Week Prediction
Target: April 18, 2025$112
$110.5
$115
$105
Description
A potential recovery is indicated as the stock approaches key support levels. The Bollinger Bands suggest a tightening range, which may lead to a breakout. However, the overall trend remains bearish, warranting caution.
Analysis
The stock has shown a bearish trend with significant price drops. Key support at $100 is critical, while resistance is at $140. The RSI indicates oversold conditions, suggesting a possible rebound, but caution is advised due to overall market sentiment.
Confidence Level
Potential Risks
Unforeseen market events or earnings surprises could lead to increased volatility, affecting the accuracy of this prediction.
1 Month Prediction
Target: May 10, 2025$115
$112
$120
$110
Description
If the stock can hold above $110, a gradual recovery may occur. The MACD shows signs of potential bullish divergence, while the RSI is improving. However, macroeconomic factors could still pose risks.
Analysis
The past three months have been marked by high volatility and bearish trends. Support at $100 is crucial, while resistance remains at $140. The stock's performance is heavily influenced by market sentiment and external economic factors.
Confidence Level
Potential Risks
Economic indicators and earnings reports could significantly impact stock performance, leading to unexpected price movements.
3 Months Prediction
Target: July 10, 2025$125
$120
$130
$115
Description
Assuming a recovery trend continues, the stock may reach $125. The Fibonacci retracement levels suggest potential resistance at this price. However, macroeconomic conditions and market sentiment remain critical factors.
Analysis
The stock has faced significant downward pressure, with key support at $100. The overall trend is bearish, but potential recovery signals are emerging. Volume patterns indicate strong trading interest, but external factors could heavily influence future performance.
Confidence Level
Potential Risks
Long-term predictions are highly uncertain due to potential market shifts, economic downturns, or changes in investor sentiment.