NVDA Trading Predictions
1 Day Prediction
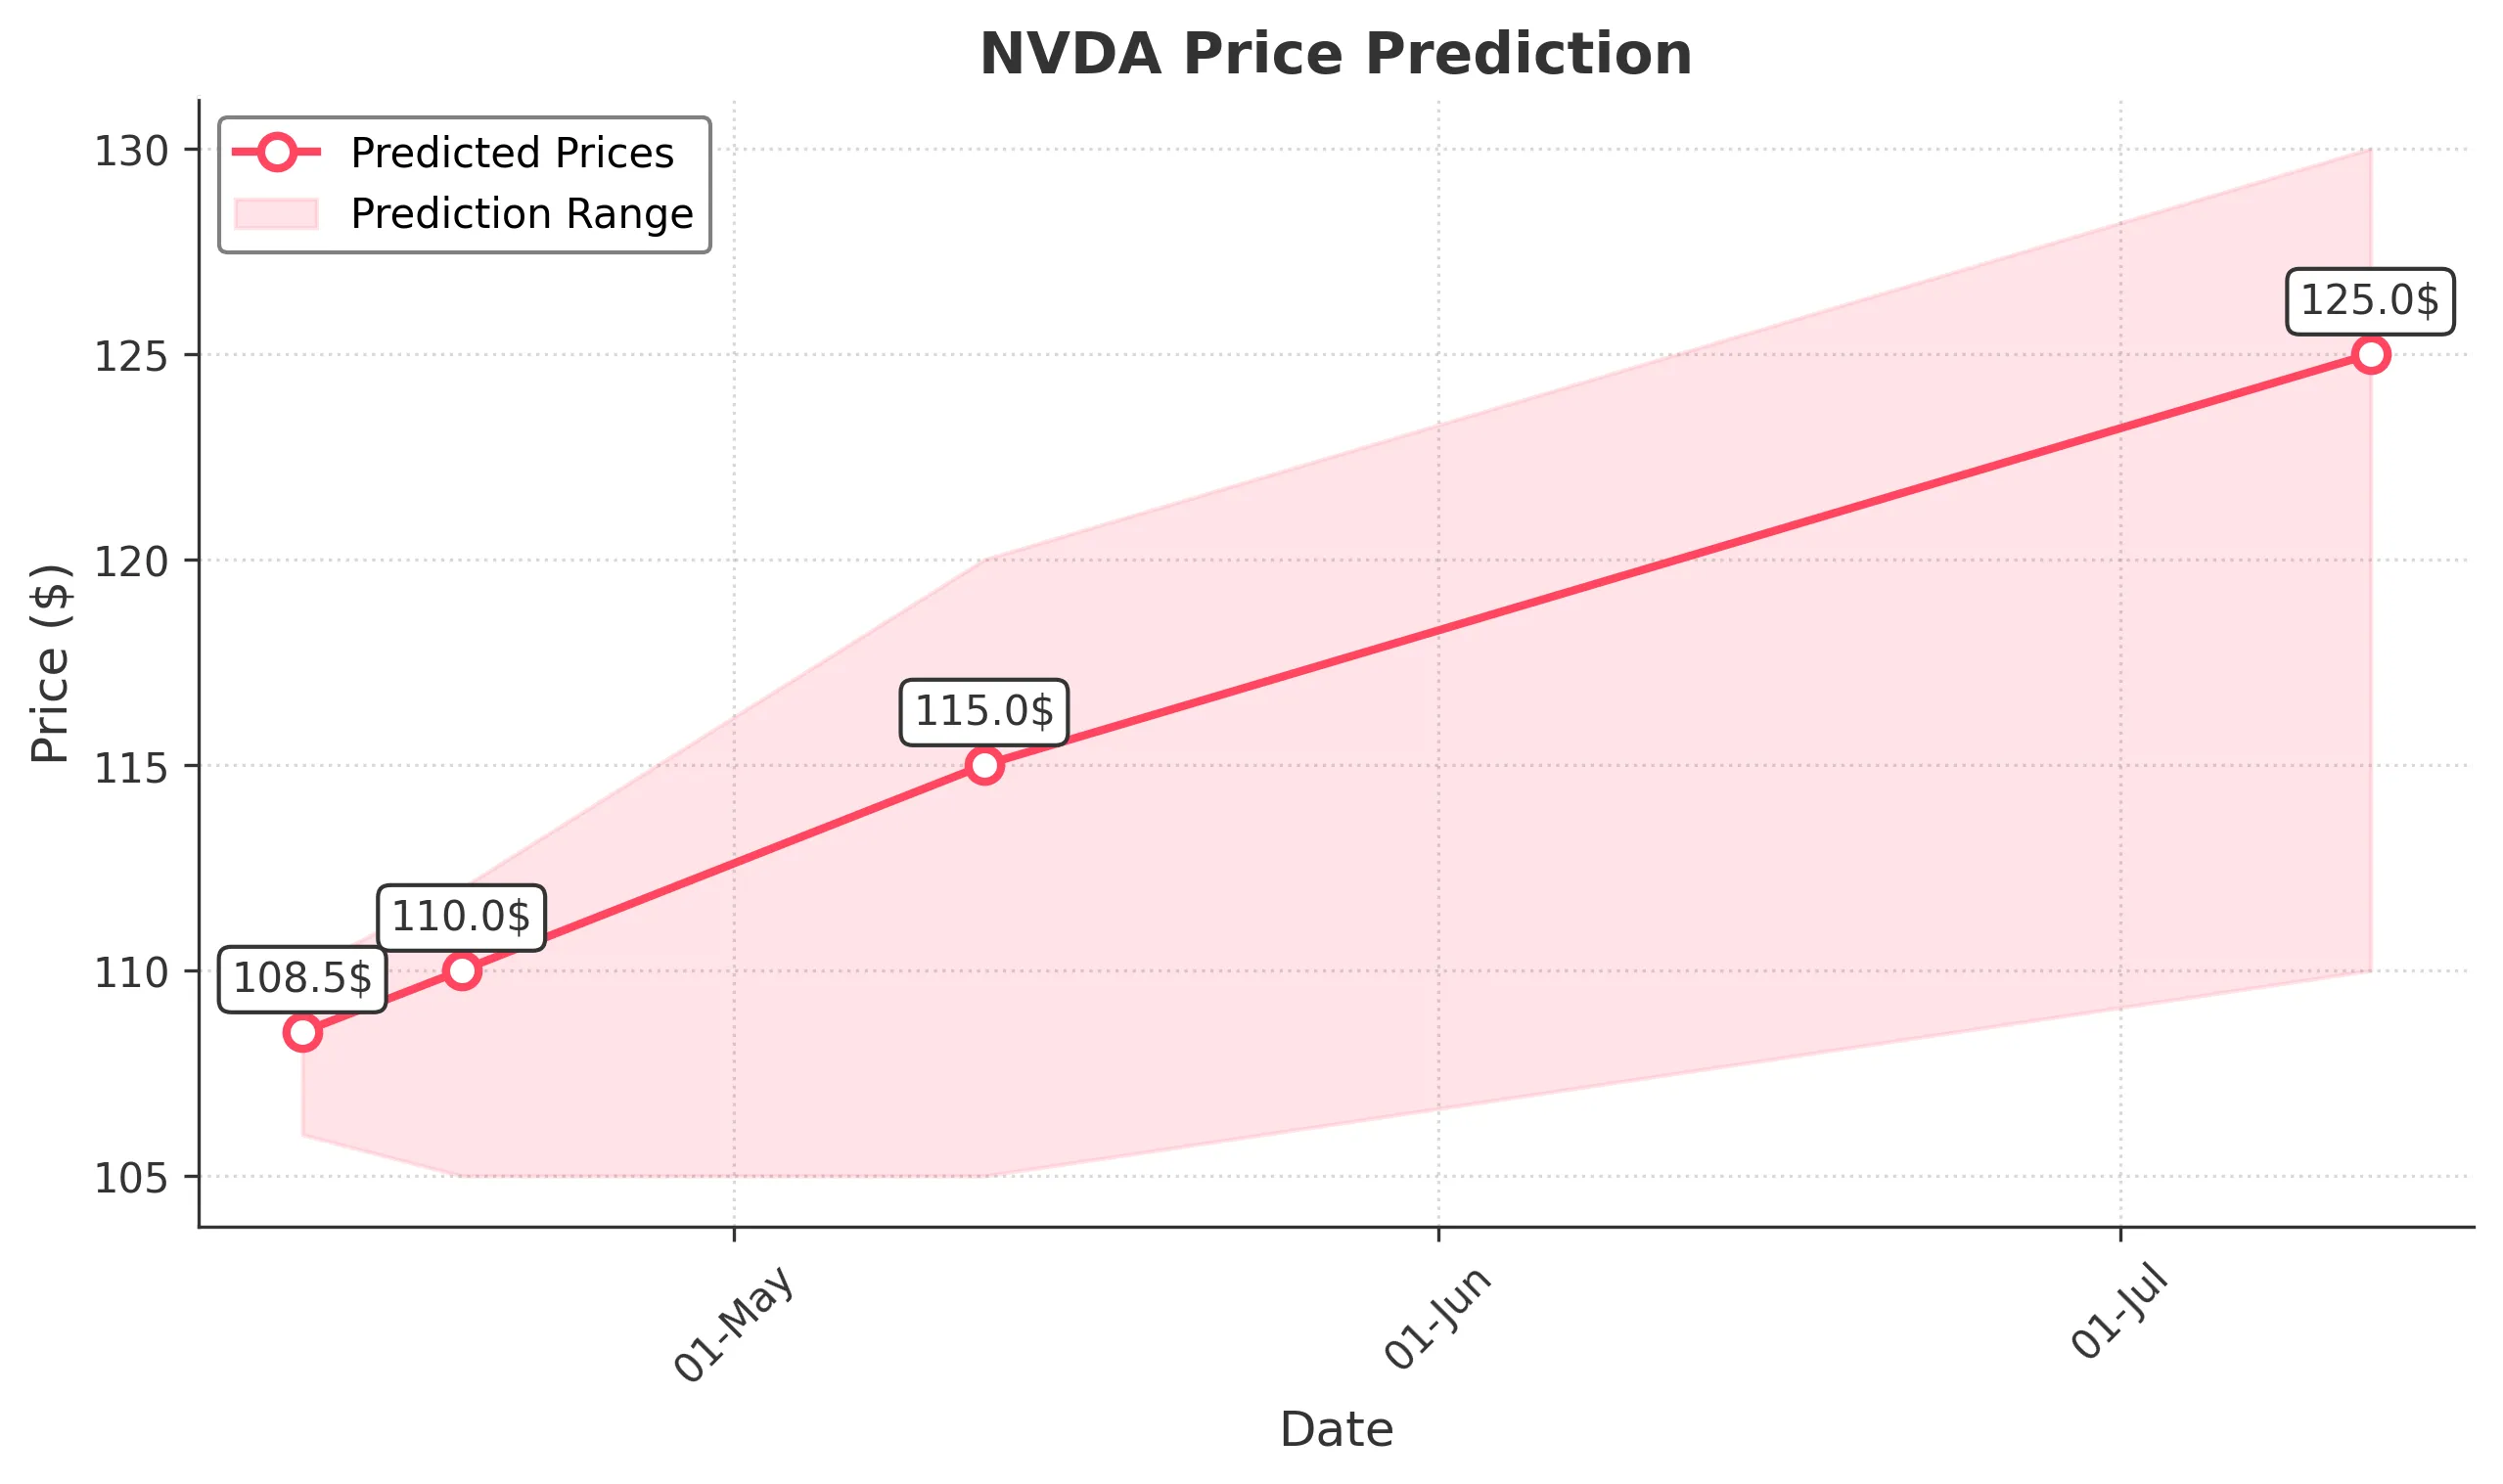
Target: April 12, 2025$108.5
$108
$110
$106
Description
The stock shows signs of stabilization after recent volatility. The RSI is near neutral, indicating potential for a slight rebound. However, the recent downtrend suggests caution. Volume remains elevated, indicating active trading.
Analysis
Over the past 3 months, NVDA has experienced significant volatility, with a bearish trend recently. Key support is around $100, while resistance is near $120. The MACD shows a bearish crossover, and the ATR indicates high volatility. Volume spikes were noted during sell-offs, suggesting strong selling pressure.
Confidence Level
Potential Risks
Market sentiment could shift quickly due to macroeconomic news or earnings reports, which may impact the prediction.
1 Week Prediction
Target: April 19, 2025$110
$109
$112
$105
Description
A potential recovery is indicated as the stock approaches key support levels. The Bollinger Bands suggest a squeeze, which may lead to a breakout. However, the overall trend remains bearish, and caution is advised.
Analysis
The stock has been in a bearish trend, with significant price drops. Support at $100 is critical, while resistance is at $120. The RSI is approaching oversold territory, suggesting a possible bounce. Volume analysis shows spikes during declines, indicating strong selling pressure.
Confidence Level
Potential Risks
Unforeseen market events or earnings surprises could lead to increased volatility, impacting the accuracy of this prediction.
1 Month Prediction
Target: May 12, 2025$115
$110
$120
$105
Description
If the stock can hold above $100, a gradual recovery may occur. The MACD shows signs of potential bullish divergence, and the RSI may improve. However, the overall market sentiment remains cautious.
Analysis
The past three months have shown a bearish trend with high volatility. Key support at $100 and resistance at $120 are critical. The stock's performance is influenced by broader market trends and sentiment, with potential for recovery if conditions stabilize.
Confidence Level
Potential Risks
Market conditions, including economic data releases and geopolitical events, could significantly affect stock performance.
3 Months Prediction
Target: July 12, 2025$125
$120
$130
$110
Description
Assuming a recovery in market sentiment and stabilization in the tech sector, NVDA could see a gradual increase. The Fibonacci retracement levels suggest potential resistance at $130, but a bullish reversal could occur if momentum builds.
Analysis
The stock has faced significant downward pressure, with key support at $100. The overall trend is bearish, but potential for recovery exists if market conditions improve. Technical indicators suggest caution, with the MACD and RSI indicating bearish momentum.
Confidence Level
Potential Risks
Long-term predictions are highly uncertain due to potential market shifts, economic conditions, and company-specific news.