NVDA Trading Predictions
1 Day Prediction
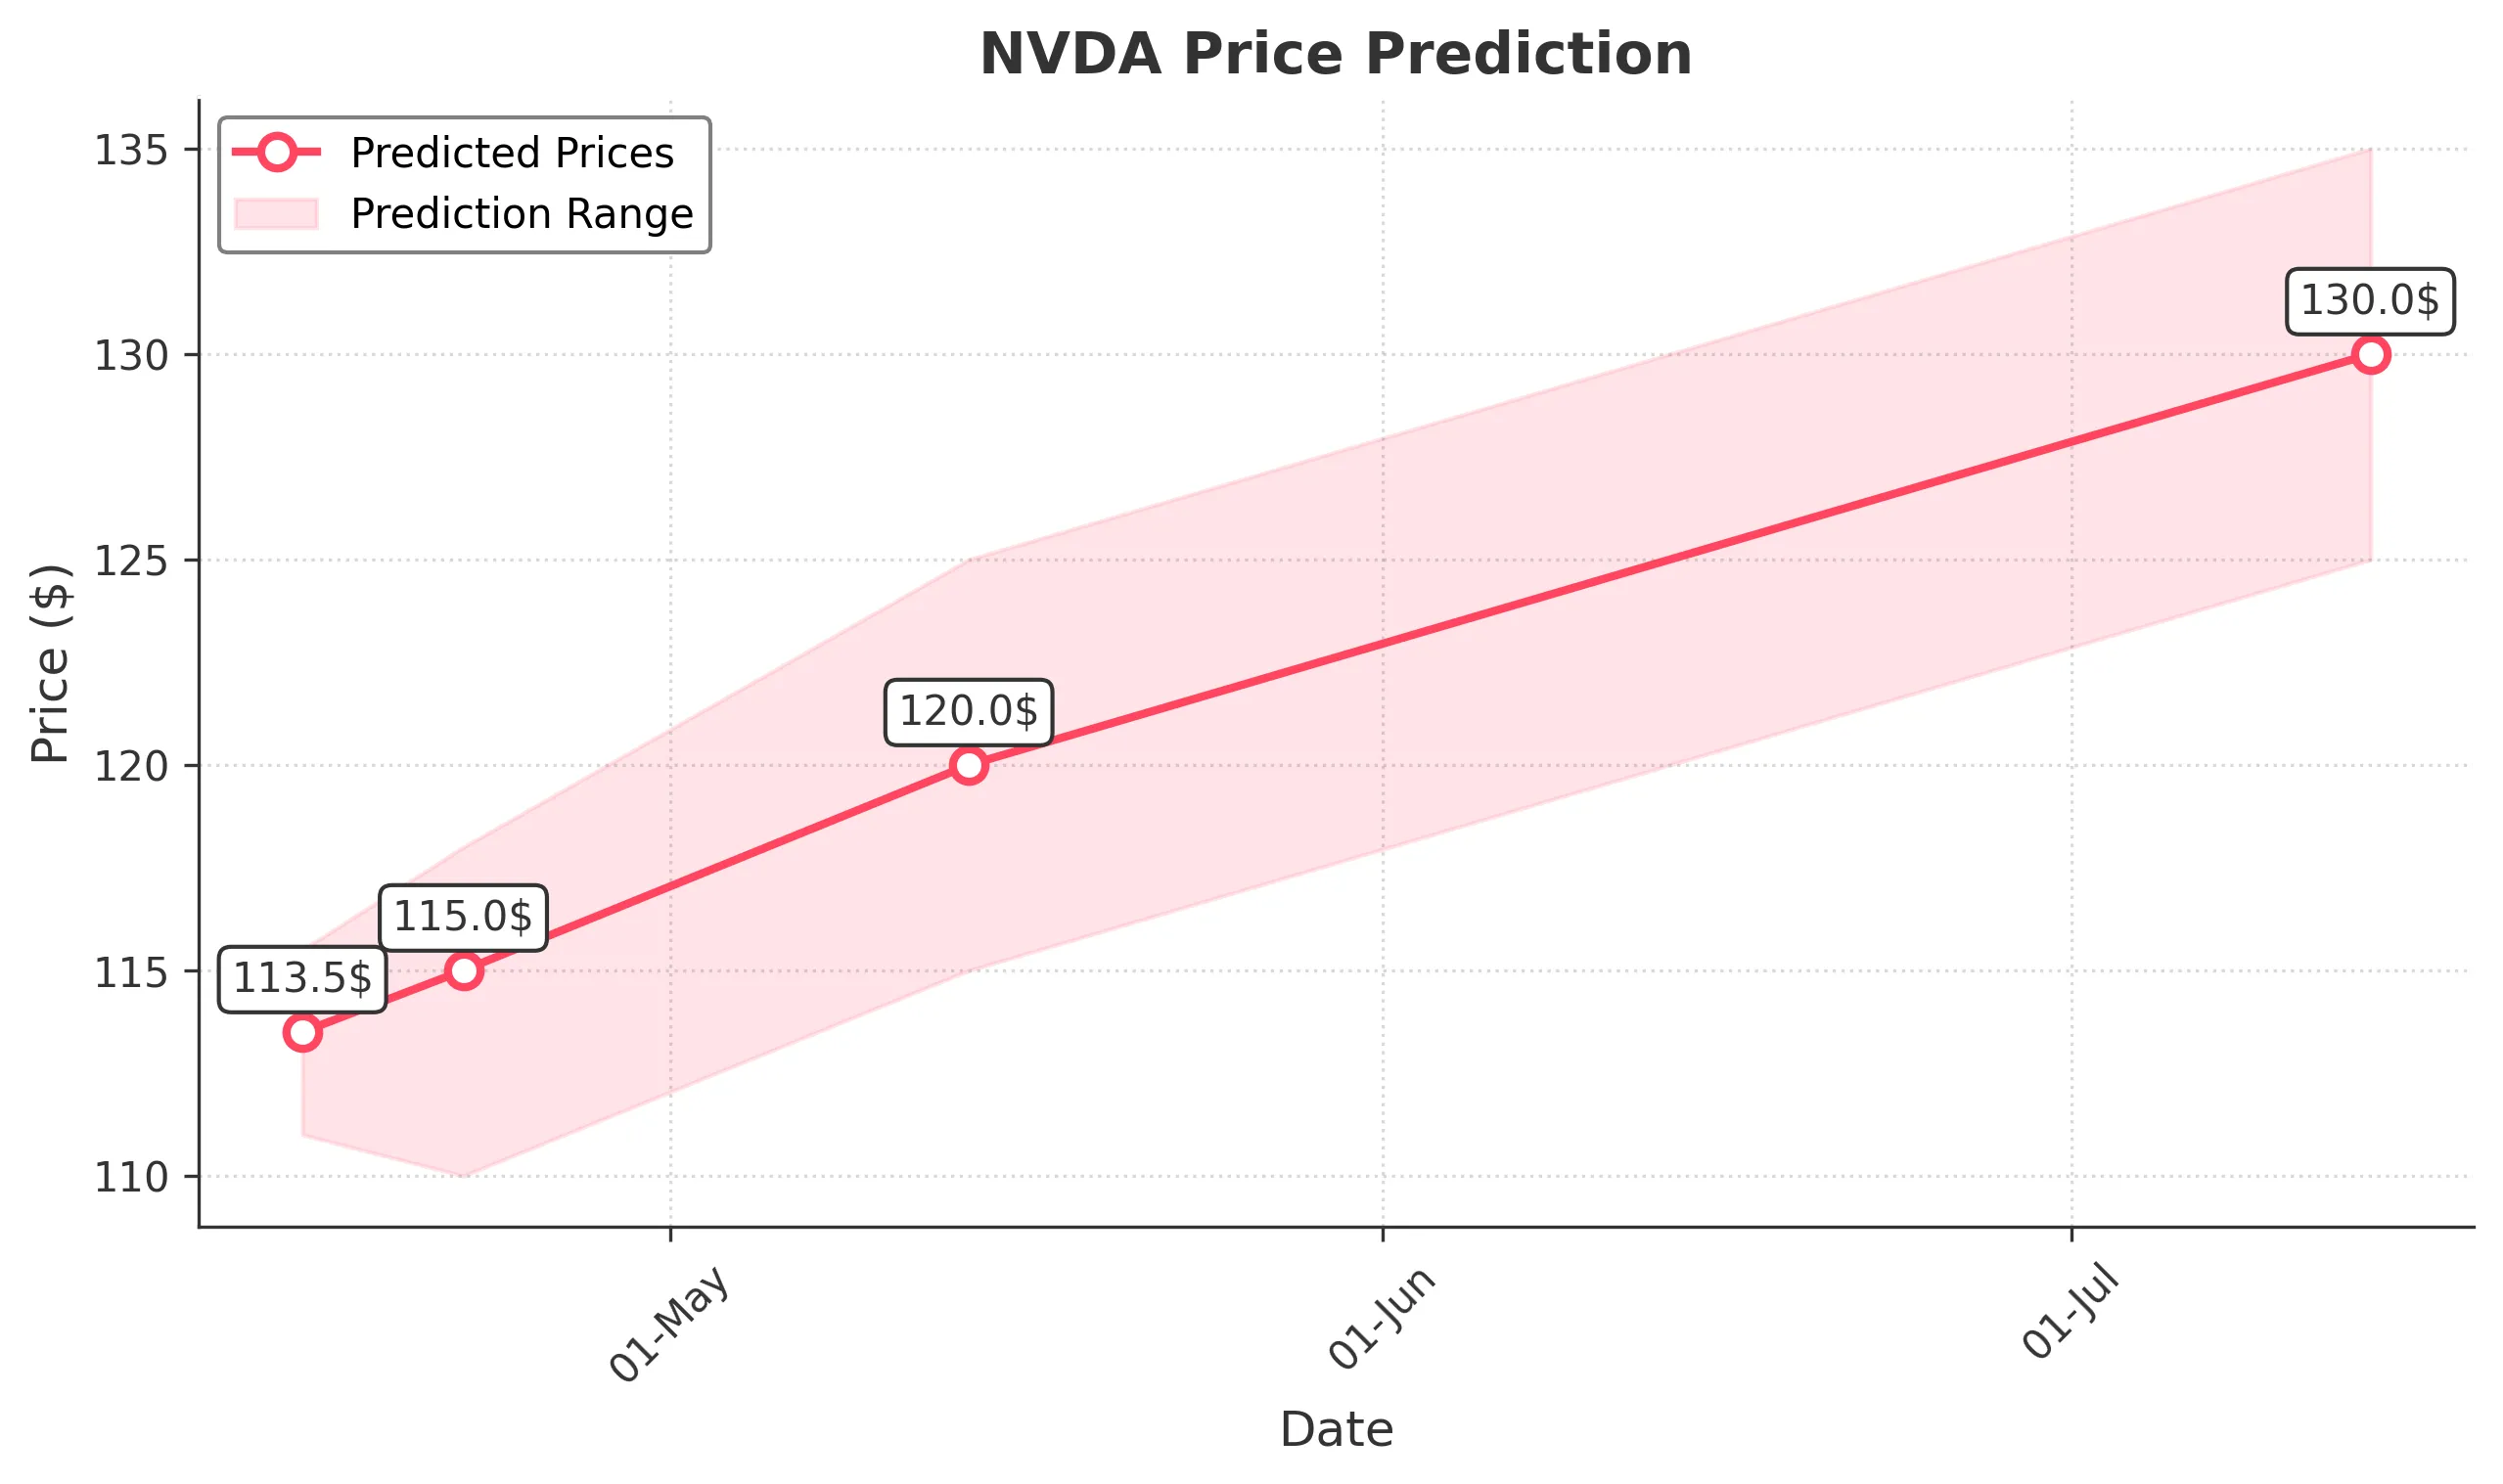
Target: April 15, 2025$113.5
$112
$115.5
$111
Description
The stock shows a slight bullish trend with a potential recovery after recent declines. RSI indicates oversold conditions, suggesting a bounce. However, volatility remains high, and market sentiment is cautious due to recent price drops.
Analysis
Over the past 3 months, NVDA has experienced significant volatility, with a bearish trend recently. Key support at $100 has been tested. Moving averages indicate a potential reversal, but the overall sentiment remains cautious due to macroeconomic factors.
Confidence Level
Potential Risks
Market volatility and external news could impact the prediction. A sudden negative sentiment could lead to further declines.
1 Week Prediction
Target: April 22, 2025$115
$113.5
$118
$110
Description
A potential recovery is expected as the stock approaches key resistance levels. The MACD shows bullish divergence, and the RSI is improving. However, the market remains sensitive to external factors, which could lead to fluctuations.
Analysis
The stock has shown a bearish trend recently, with significant volume spikes indicating selling pressure. Support levels are being tested, and while there are signs of recovery, the overall market sentiment remains cautious.
Confidence Level
Potential Risks
Unforeseen macroeconomic events or earnings reports could lead to volatility, impacting the accuracy of this prediction.
1 Month Prediction
Target: May 14, 2025$120
$118
$125
$115
Description
Expect a gradual recovery as the stock stabilizes. The Bollinger Bands suggest a potential breakout, and the RSI is moving towards neutral territory. However, macroeconomic conditions could still pose risks.
Analysis
The stock has been in a bearish phase, but recent patterns suggest a potential reversal. Key resistance levels are being approached, and while there are signs of recovery, external factors could influence the trajectory.
Confidence Level
Potential Risks
Economic indicators and earnings reports could lead to unexpected volatility, affecting the stock's performance.
3 Months Prediction
Target: July 14, 2025$130
$128
$135
$125
Description
Long-term recovery is anticipated as the stock stabilizes and market sentiment improves. Technical indicators suggest a bullish trend, but external economic factors could still impact performance.
Analysis
The stock has faced significant volatility, with a bearish trend recently. However, signs of recovery are emerging, and if the market sentiment improves, NVDA could see a gradual upward trend. Key resistance levels will be crucial.
Confidence Level
Potential Risks
Potential market corrections or economic downturns could hinder recovery, leading to unexpected price movements.