NVDA Trading Predictions
1 Day Prediction
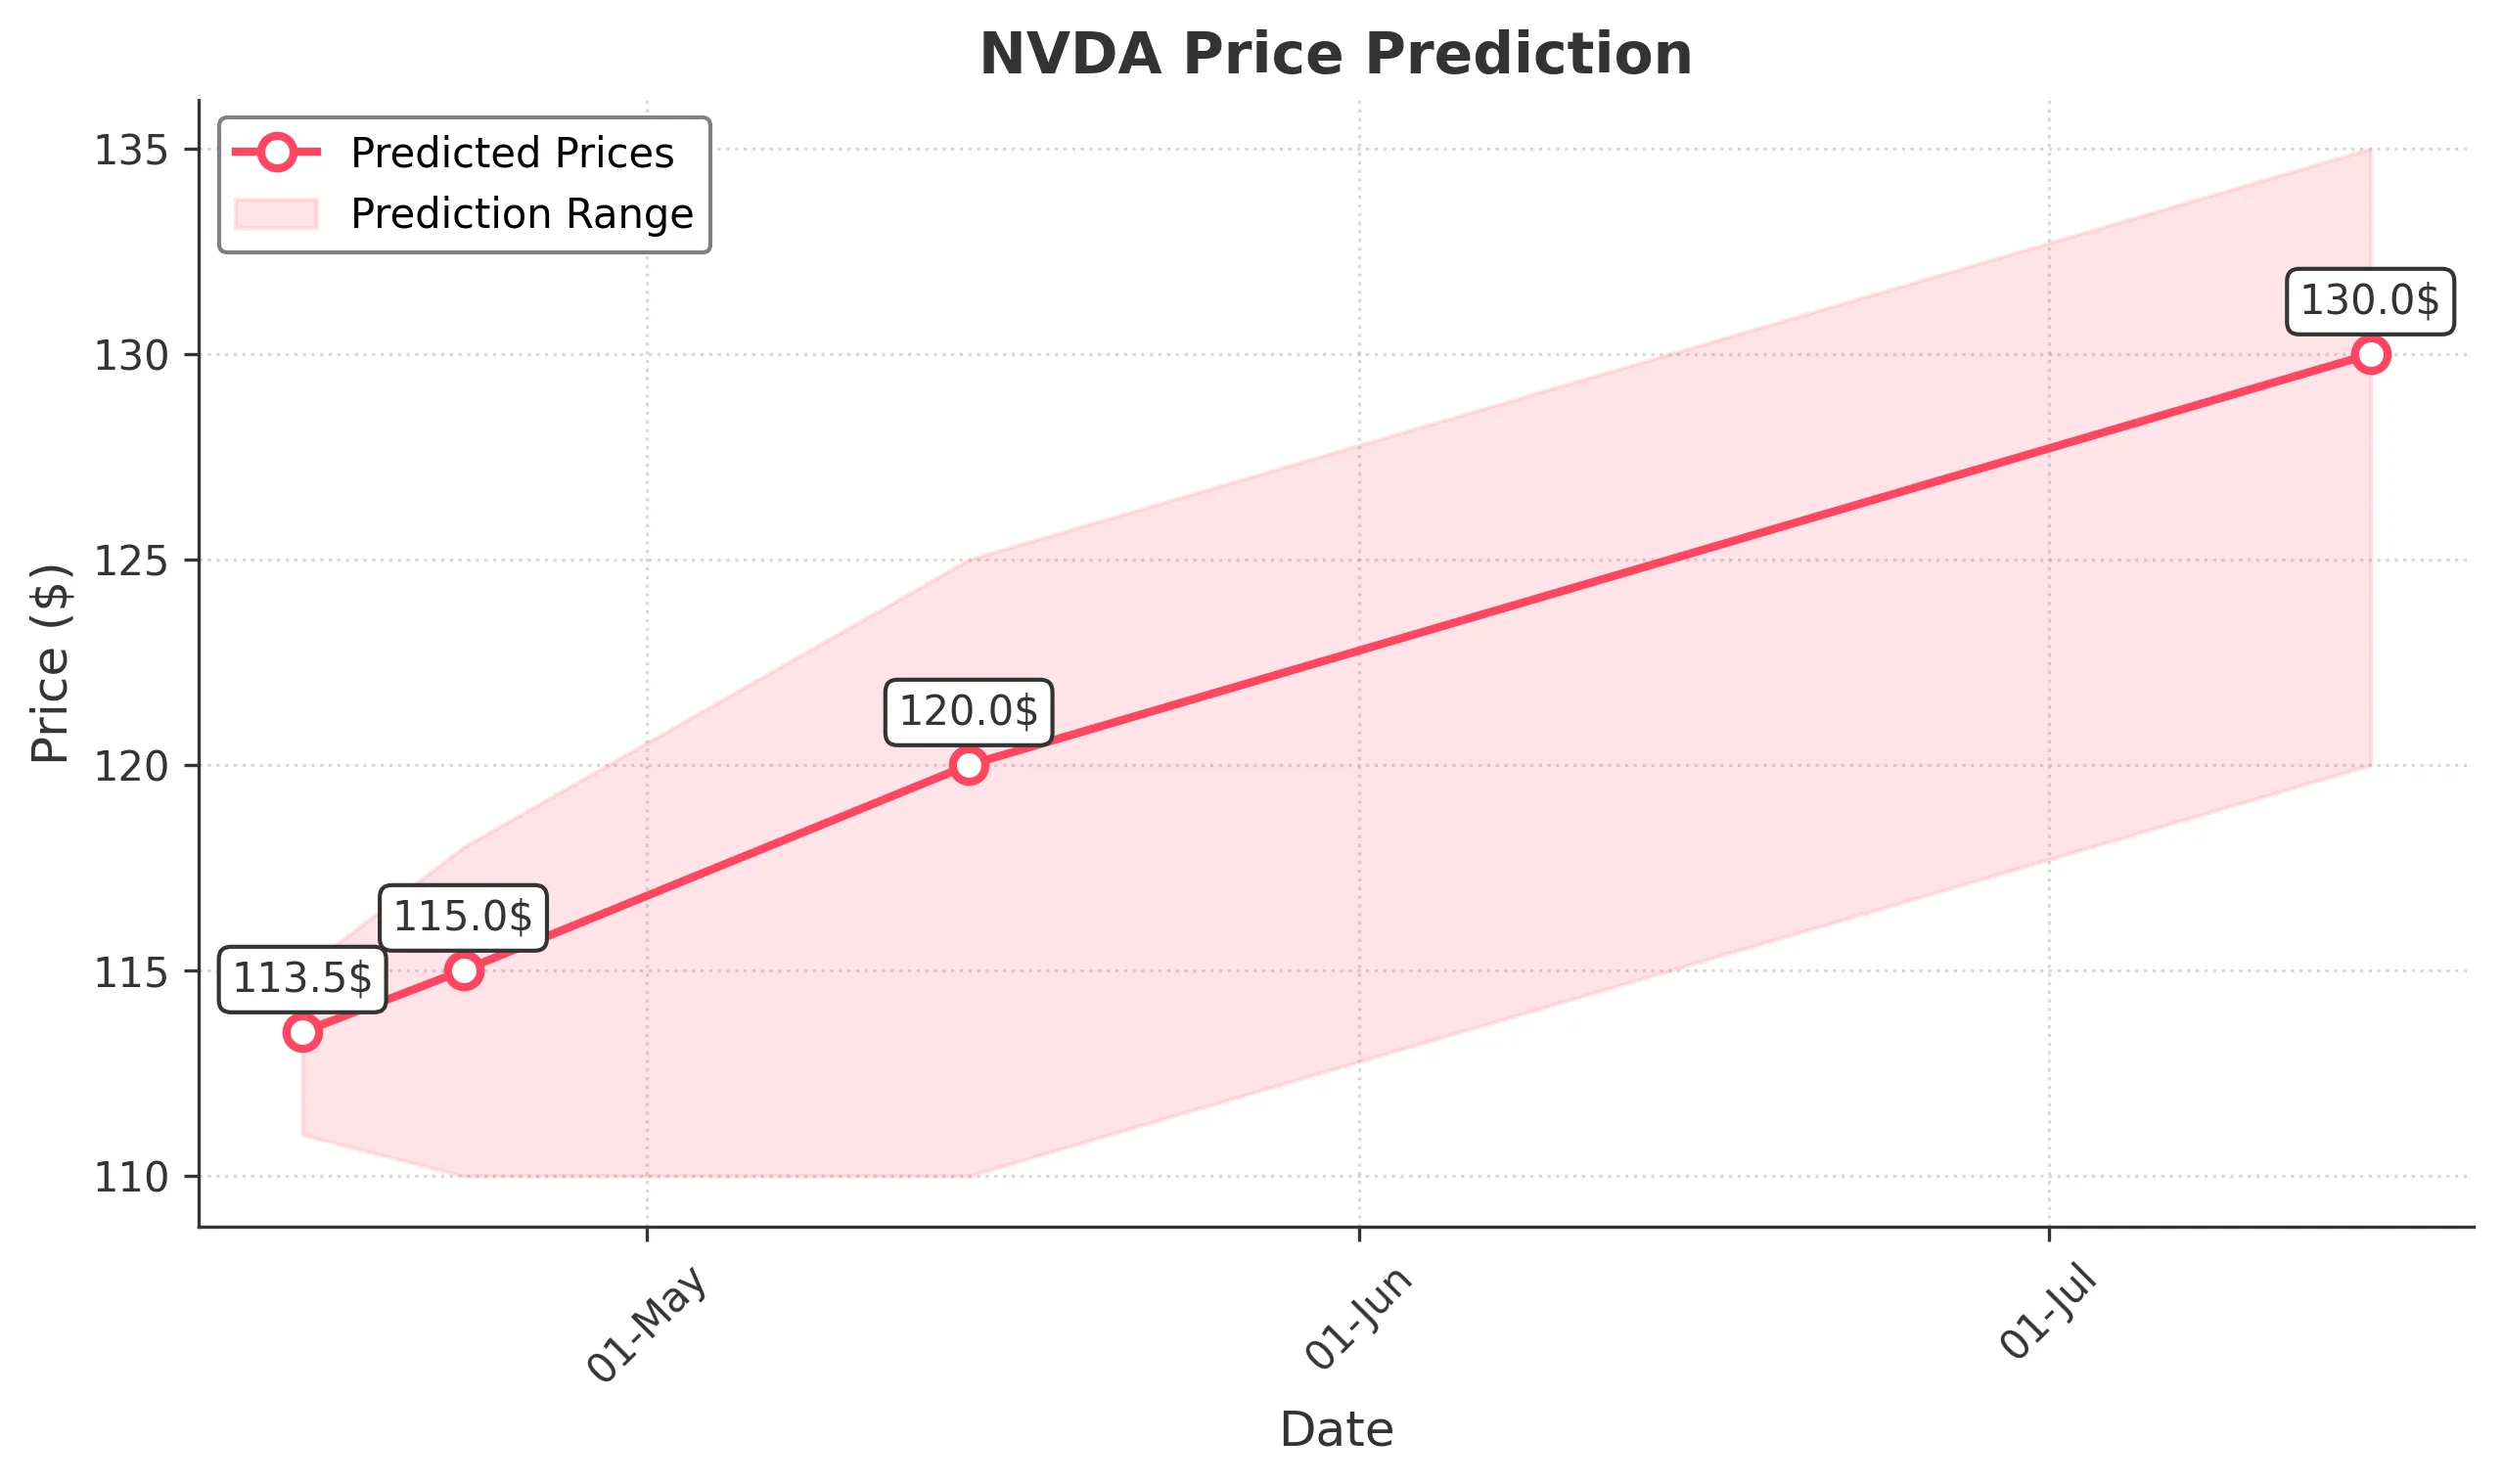
Target: April 16, 2025$113.5
$112.5
$115
$111
Description
The stock shows a slight bullish trend with a potential bounce from recent lows. RSI indicates oversold conditions, while MACD is showing a bullish crossover. However, volatility remains high, suggesting caution.
Analysis
Over the past 3 months, NVDA has experienced significant volatility, with a bearish trend recently. Key support at $100 and resistance at $140. Technical indicators show mixed signals, with RSI indicating oversold conditions, while MACD suggests potential bullish momentum.
Confidence Level
Potential Risks
Market sentiment could shift due to macroeconomic news or earnings reports, which may impact the prediction.
1 Week Prediction
Target: April 23, 2025$115
$113
$118
$110
Description
Expect a gradual recovery as the stock may find support around $110. The recent bullish candlestick patterns suggest a potential reversal, but external factors could still influence price movements.
Analysis
The stock has shown a bearish trend recently, with significant volume spikes indicating selling pressure. Key support at $100 and resistance at $120. Technical indicators are mixed, with potential for a short-term recovery but overall bearish sentiment.
Confidence Level
Potential Risks
Uncertainty in the broader market and potential earnings surprises could lead to unexpected price movements.
1 Month Prediction
Target: May 15, 2025$120
$115
$125
$110
Description
A potential recovery is anticipated as the stock stabilizes. The bullish divergence in RSI and MACD suggests upward momentum, but caution is advised due to market volatility.
Analysis
The stock has been in a bearish phase, with significant fluctuations. Support at $100 and resistance at $130. Technical indicators show signs of potential recovery, but overall market sentiment remains cautious.
Confidence Level
Potential Risks
Market conditions and external economic factors could hinder recovery, leading to potential price declines.
3 Months Prediction
Target: July 15, 2025$130
$125
$135
$120
Description
Long-term recovery is expected as the stock may stabilize above key support levels. Positive market sentiment and potential product launches could drive prices higher.
Analysis
The stock has shown significant volatility with a bearish trend recently. Key support at $100 and resistance at $140. Technical indicators suggest potential for recovery, but external factors could influence price movements.
Confidence Level
Potential Risks
Macroeconomic factors and competitive pressures could impact growth, leading to potential volatility.