NVDA Trading Predictions
1 Day Prediction
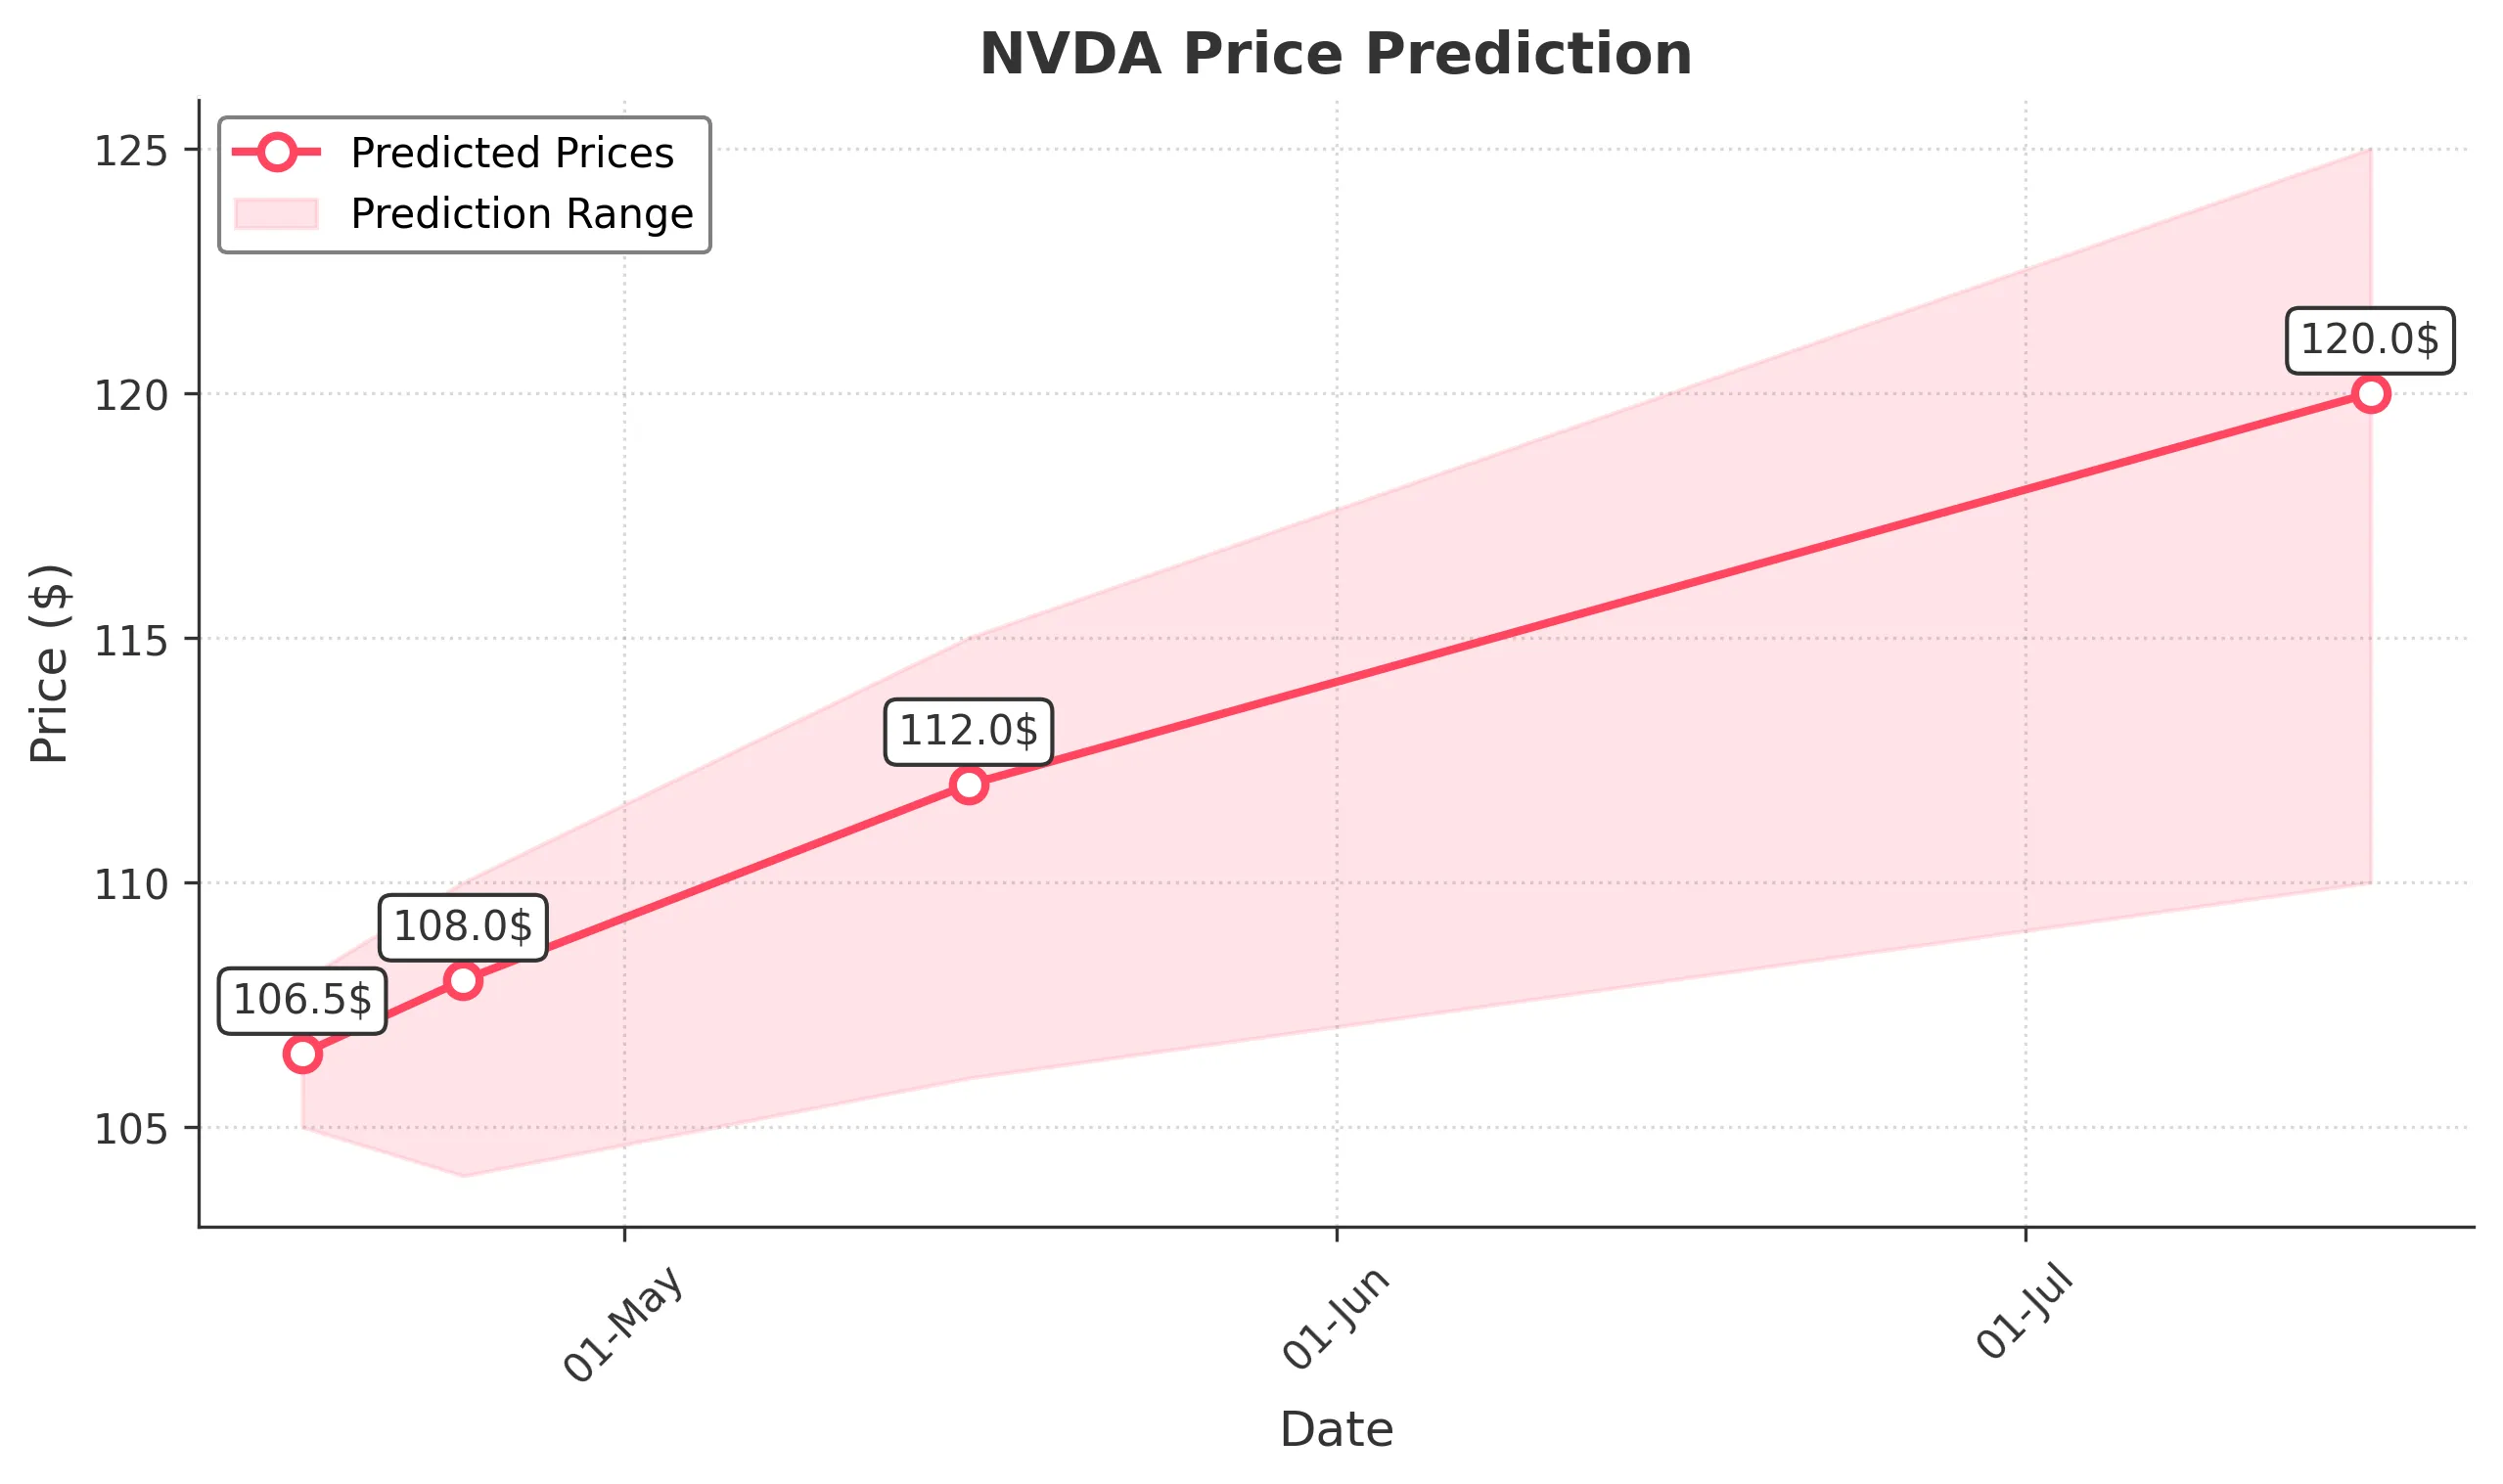
Target: April 17, 2025$106.5
$106
$108
$105
Description
The stock shows signs of consolidation around the 106 level, with recent support at 105. The RSI is neutral, and MACD indicates a potential bullish crossover. However, volatility remains high, suggesting caution.
Analysis
Over the past 3 months, NVDA has experienced significant volatility, with a bearish trend recently. Key support is at 105, while resistance is around 110. Volume spikes indicate potential reversals, but overall sentiment remains cautious.
Confidence Level
Potential Risks
Market sentiment could shift due to macroeconomic news or earnings reports, which may impact trading volume and price direction.
1 Week Prediction
Target: April 24, 2025$108
$107.5
$110
$104
Description
Expect a slight recovery as the stock tests resistance at 110. The MACD is showing bullish momentum, but the RSI is approaching overbought territory, indicating potential pullbacks.
Analysis
The stock has been in a bearish phase, with recent attempts to recover. Key resistance at 110 and support at 105 are critical. Volume analysis shows increased activity, suggesting traders are positioning for potential rebounds.
Confidence Level
Potential Risks
Uncertainty in the broader market and potential earnings surprises could lead to unexpected price movements.
1 Month Prediction
Target: May 16, 2025$112
$110
$115
$106
Description
A gradual recovery is anticipated as the stock stabilizes above 110. The bullish MACD and improving RSI suggest upward momentum, but caution is warranted due to potential market corrections.
Analysis
The stock has shown resilience despite recent declines. Key support at 106 and resistance at 115 are pivotal. Technical indicators suggest a potential bullish reversal, but external factors could impact performance.
Confidence Level
Potential Risks
Market volatility and external economic factors could disrupt the anticipated recovery, leading to price fluctuations.
3 Months Prediction
Target: July 16, 2025$120
$118
$125
$110
Description
Long-term recovery is expected as the stock breaks above 115. Positive market sentiment and strong earnings could drive prices higher, but macroeconomic uncertainties remain a risk.
Analysis
Over the past 3 months, NVDA has faced significant volatility, with a bearish trend recently. However, signs of recovery are emerging. Key resistance at 125 and support at 110 will be crucial in determining future price movements.
Confidence Level
Potential Risks
Potential economic downturns or changes in market sentiment could lead to unexpected price corrections.