NVDA Trading Predictions
1 Day Prediction
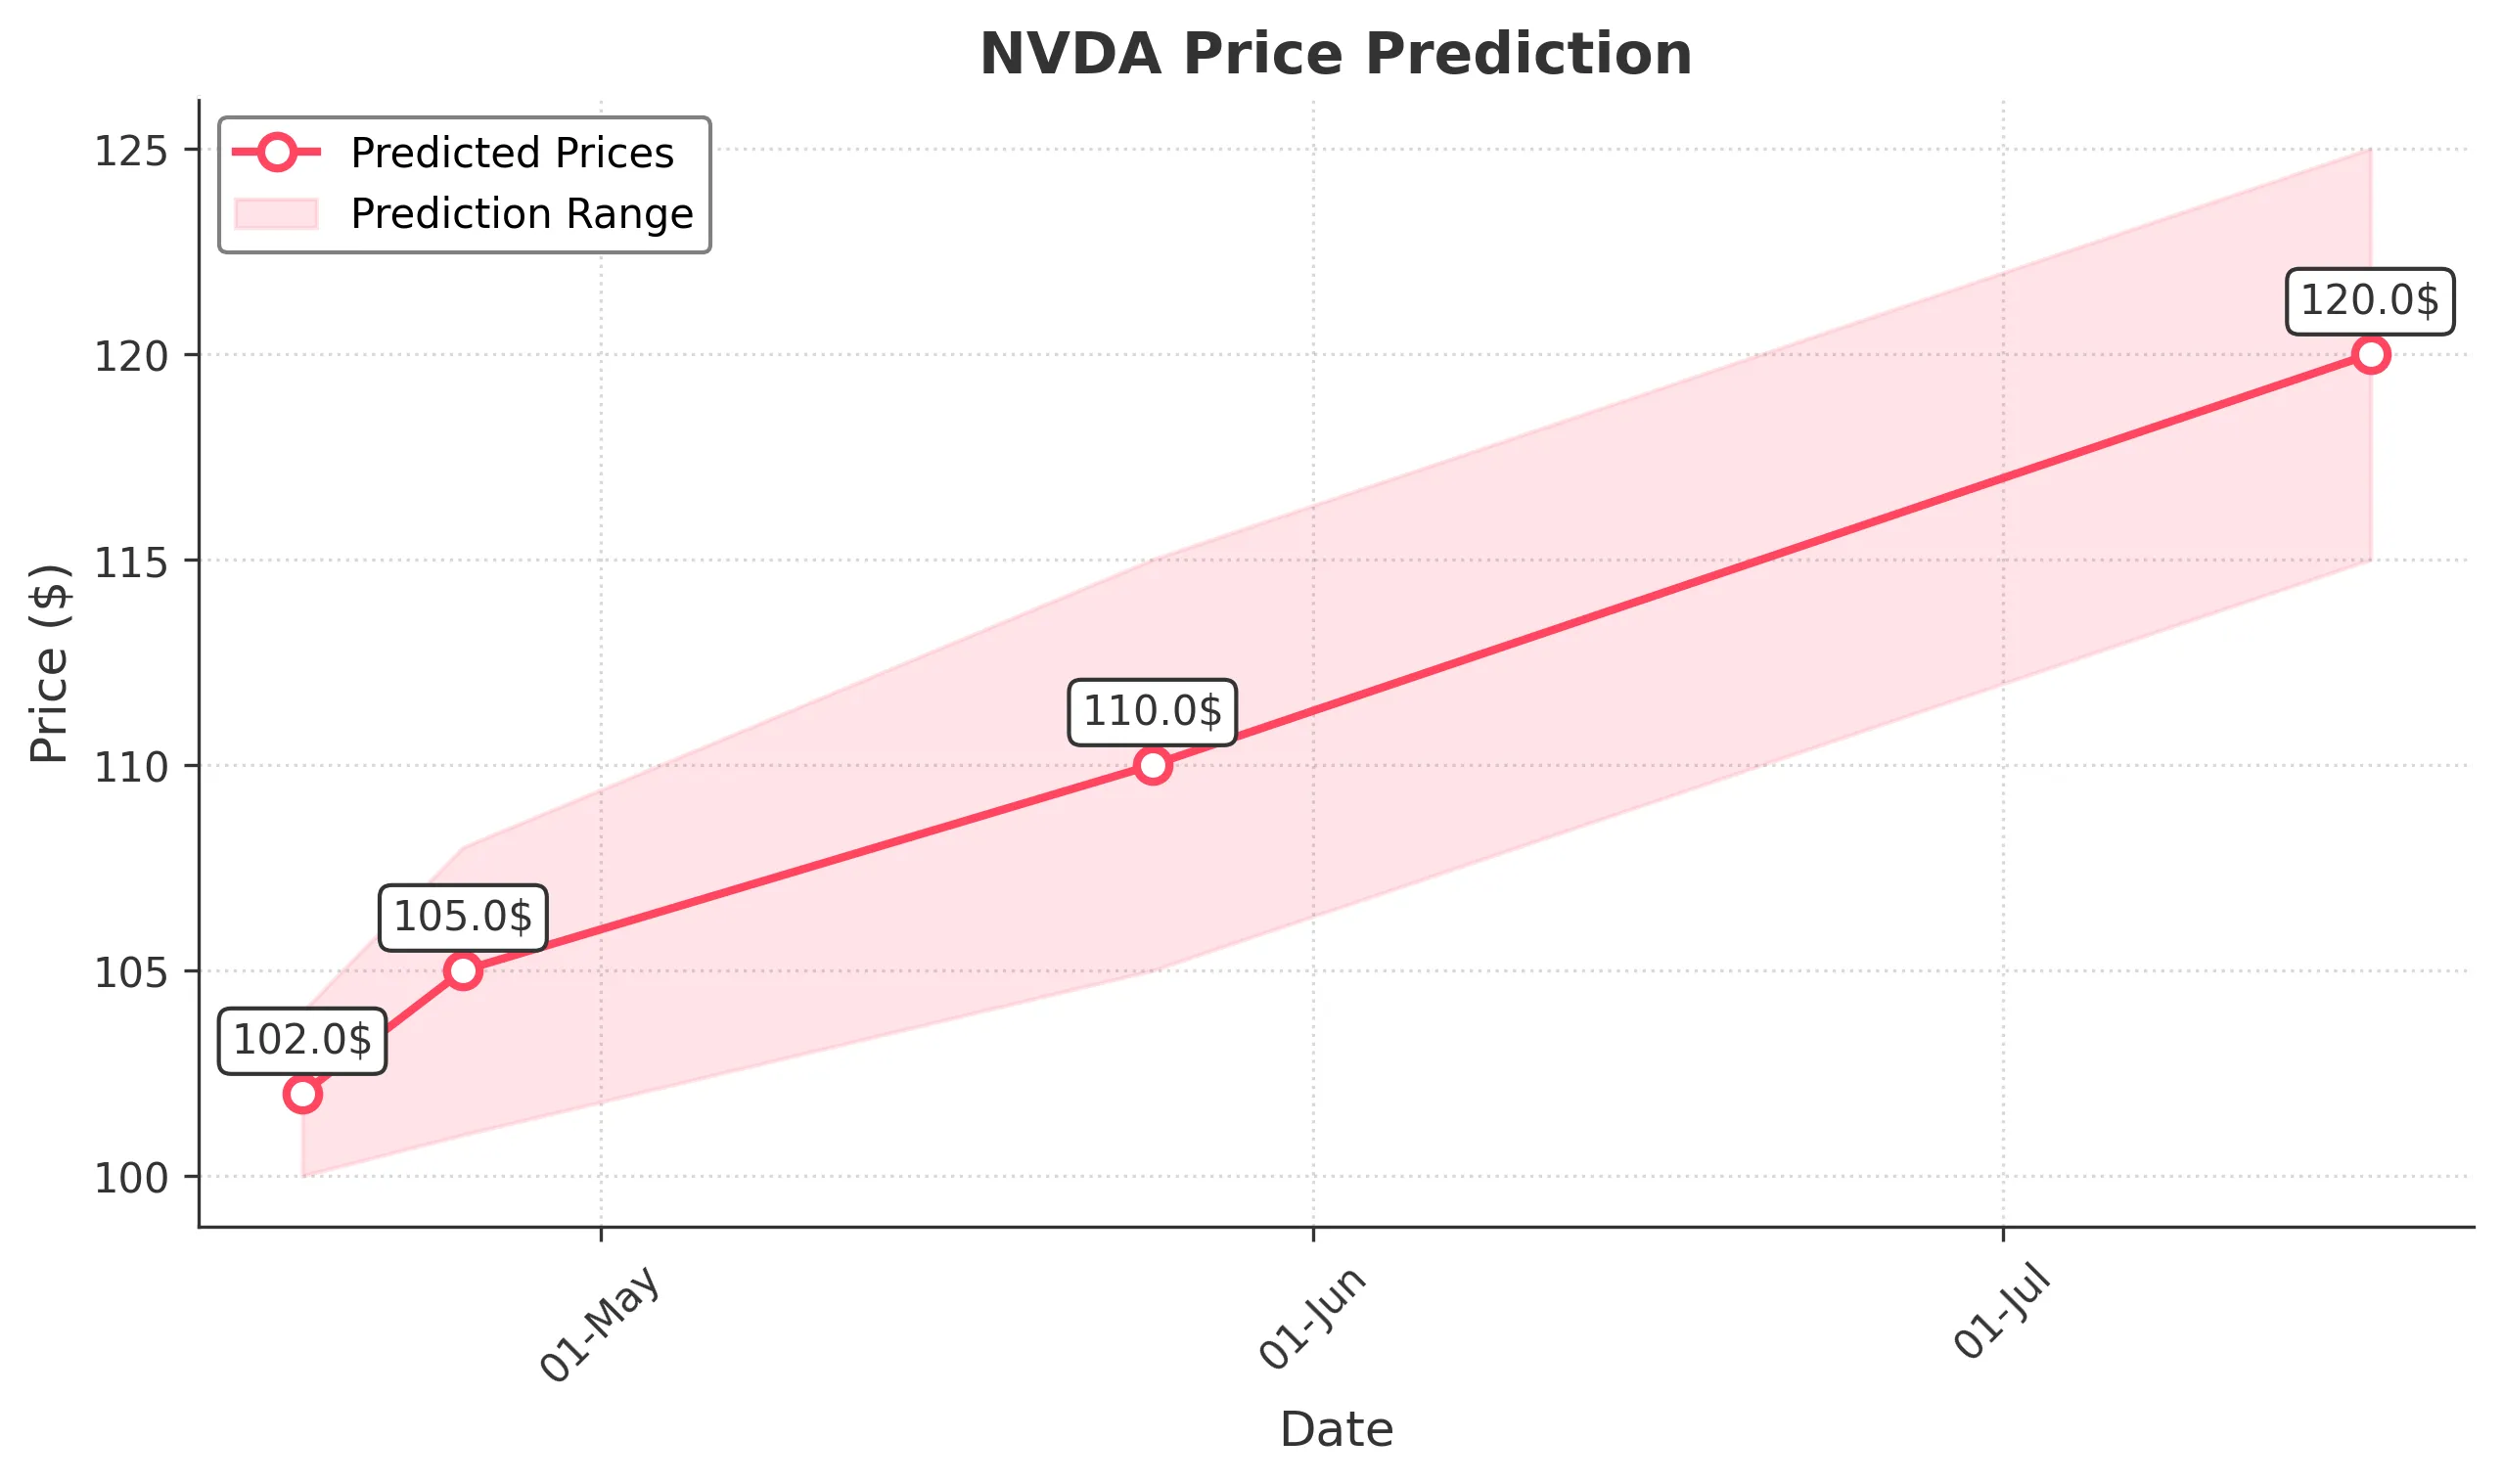
Target: April 18, 2025$102
$103
$104
$100
Description
Given the recent bearish trend and the closing price drop, the prediction reflects continued selling pressure. The RSI indicates oversold conditions, but a potential bounce could occur. Volume remains high, suggesting strong market activity.
Analysis
Over the past 3 months, NVDA has shown a bearish trend with significant price drops. Key support levels are around $100, while resistance is near $110. The RSI is low, indicating oversold conditions, but MACD shows bearish momentum. Volume spikes suggest strong selling pressure.
Confidence Level
Potential Risks
Market volatility and potential news could impact the price significantly.
1 Week Prediction
Target: April 25, 2025$105
$102
$108
$101
Description
A slight recovery is anticipated as the stock may find support at $100. The RSI may begin to recover, indicating potential buying interest. However, bearish sentiment remains prevalent, and caution is advised.
Analysis
The stock has been in a downtrend, with significant resistance at $110. Recent candlestick patterns show indecision, and the ATR indicates high volatility. Volume analysis suggests strong selling, but a potential reversal could occur if support holds.
Confidence Level
Potential Risks
Unforeseen market events or earnings reports could lead to further declines.
1 Month Prediction
Target: May 25, 2025$110
$106
$115
$105
Description
If the stock stabilizes, a gradual recovery towards $110 is possible. The RSI may normalize, and bullish divergence could form if the price holds above $100. However, macroeconomic factors could still weigh heavily.
Analysis
The stock has faced significant downward pressure, with key support at $100. The MACD is bearish, but a potential bullish divergence may form. Volume patterns indicate strong selling, but a recovery could occur if market sentiment improves.
Confidence Level
Potential Risks
Economic indicators and market sentiment could shift, impacting recovery.
3 Months Prediction
Target: July 17, 2025$120
$118
$125
$115
Description
Assuming a recovery in market sentiment and stabilization of the stock, a rise towards $120 is plausible. The RSI may indicate a bullish trend if the price breaks above resistance levels. However, external factors remain a risk.
Analysis
The stock has been in a bearish phase, with significant resistance at $125. The ATR indicates high volatility, and the MACD remains bearish. Volume analysis shows strong selling pressure, but a potential recovery could occur if market conditions improve.
Confidence Level
Potential Risks
Market volatility and economic conditions could hinder recovery efforts.