NVDA Trading Predictions
1 Day Prediction
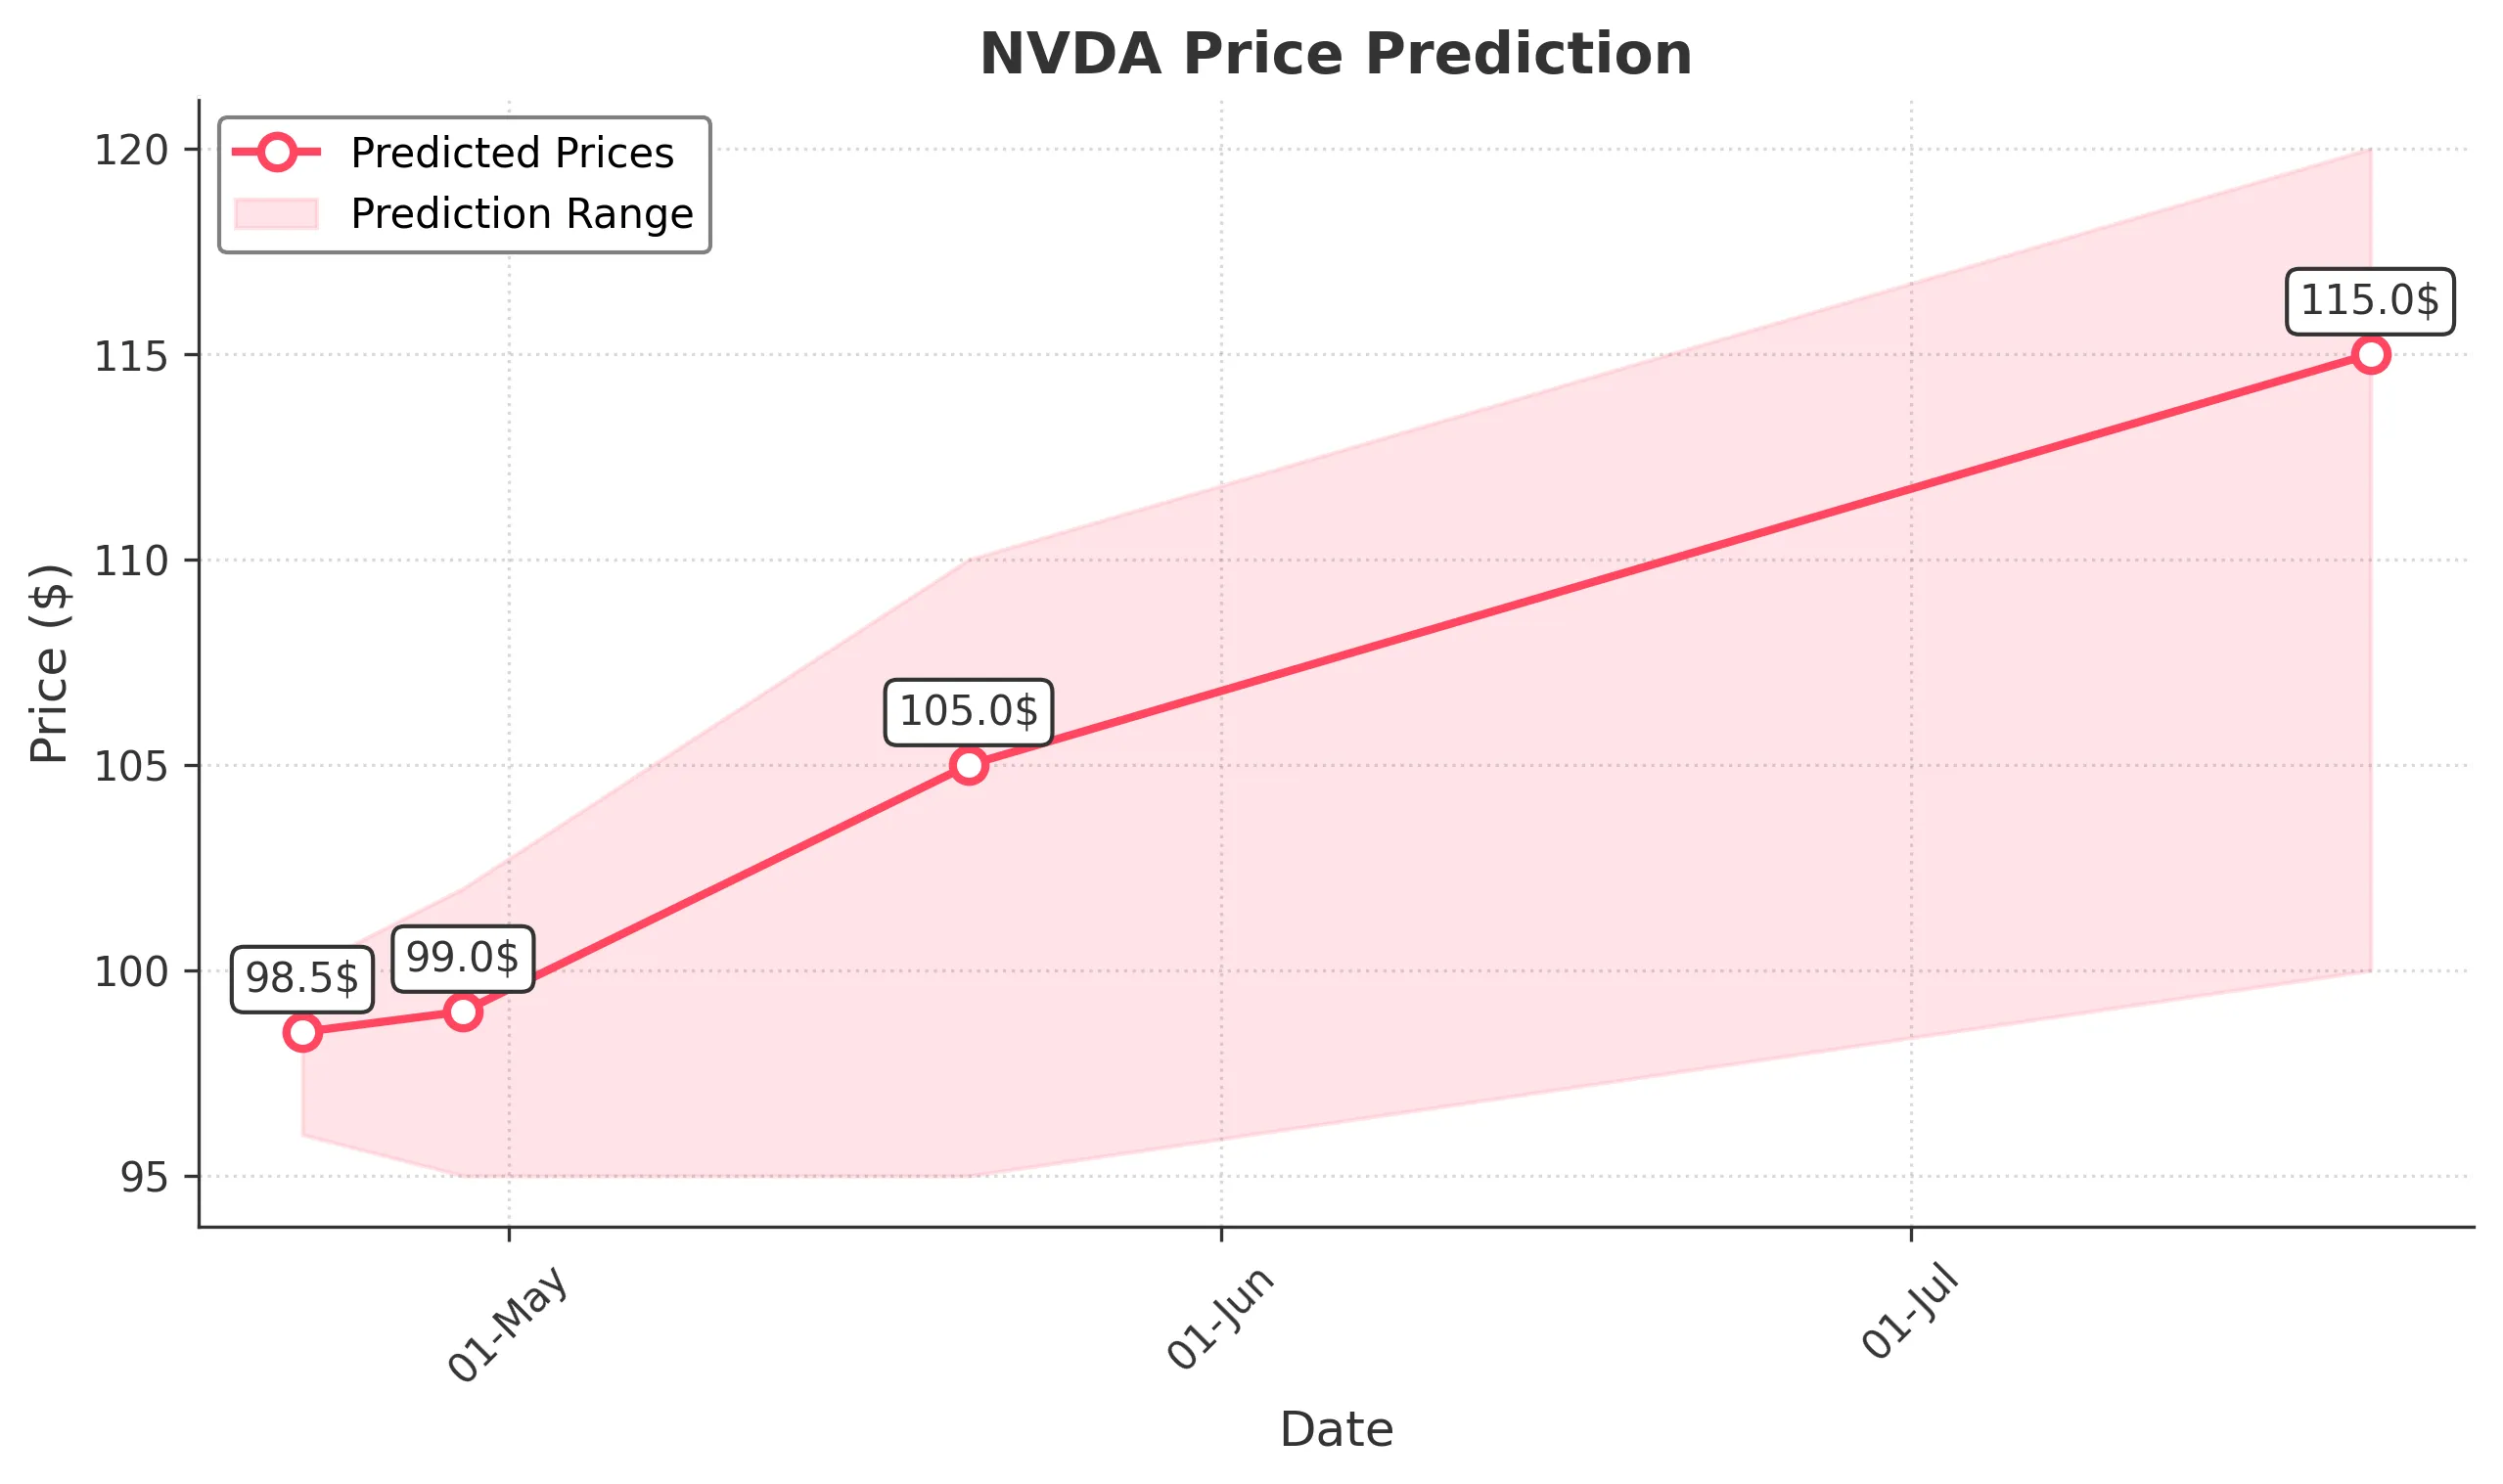
Target: April 22, 2025$98.5
$97.8
$100
$96
Description
The stock shows signs of a slight recovery after recent declines, but bearish sentiment persists. RSI indicates oversold conditions, while MACD shows a potential bullish crossover. However, volatility remains high, suggesting caution.
Analysis
Over the past 3 months, NVDA has experienced significant volatility, with a bearish trend recently. Key support is around $97, while resistance is near $110. Volume spikes indicate heightened trading activity, and the overall sentiment remains cautious.
Confidence Level
Potential Risks
Market sentiment could shift rapidly due to macroeconomic news or earnings reports, impacting the prediction.
1 Week Prediction
Target: April 29, 2025$99
$98.5
$102
$95
Description
A potential rebound is expected as the stock approaches key support levels. The RSI is recovering, and MACD shows bullish momentum. However, external factors like earnings could influence volatility.
Analysis
The stock has been in a bearish phase, with significant drops in price. Support at $97 is critical, while resistance is at $110. The recent volume patterns suggest increased interest, but overall market sentiment remains cautious.
Confidence Level
Potential Risks
Earnings reports or macroeconomic data releases could lead to unexpected price movements, affecting the accuracy of this prediction.
1 Month Prediction
Target: May 21, 2025$105
$100
$110
$95
Description
Expect gradual recovery as the stock stabilizes. Technical indicators suggest a potential reversal, with RSI moving towards neutral. However, macroeconomic conditions could still pose risks.
Analysis
The stock has shown a bearish trend with significant volatility. Key support at $97 and resistance at $110 are crucial. Volume analysis indicates increased trading activity, but overall sentiment remains mixed, with potential for both upward and downward movements.
Confidence Level
Potential Risks
Unforeseen market events or changes in investor sentiment could derail the recovery, leading to further declines.
3 Months Prediction
Target: July 21, 2025$115
$110
$120
$100
Description
Long-term recovery is anticipated as the stock finds support. Technical indicators suggest a bullish trend may develop, but external economic factors could impact performance.
Analysis
The stock has faced significant challenges, with a bearish trend recently. Key support at $97 and resistance at $110 are critical. Volume patterns indicate increased trading interest, but overall market sentiment remains uncertain, with potential for both upward and downward movements.
Confidence Level
Potential Risks
Market volatility and economic conditions could lead to unexpected price fluctuations, affecting the prediction's reliability.