NVDA Trading Predictions
1 Day Prediction
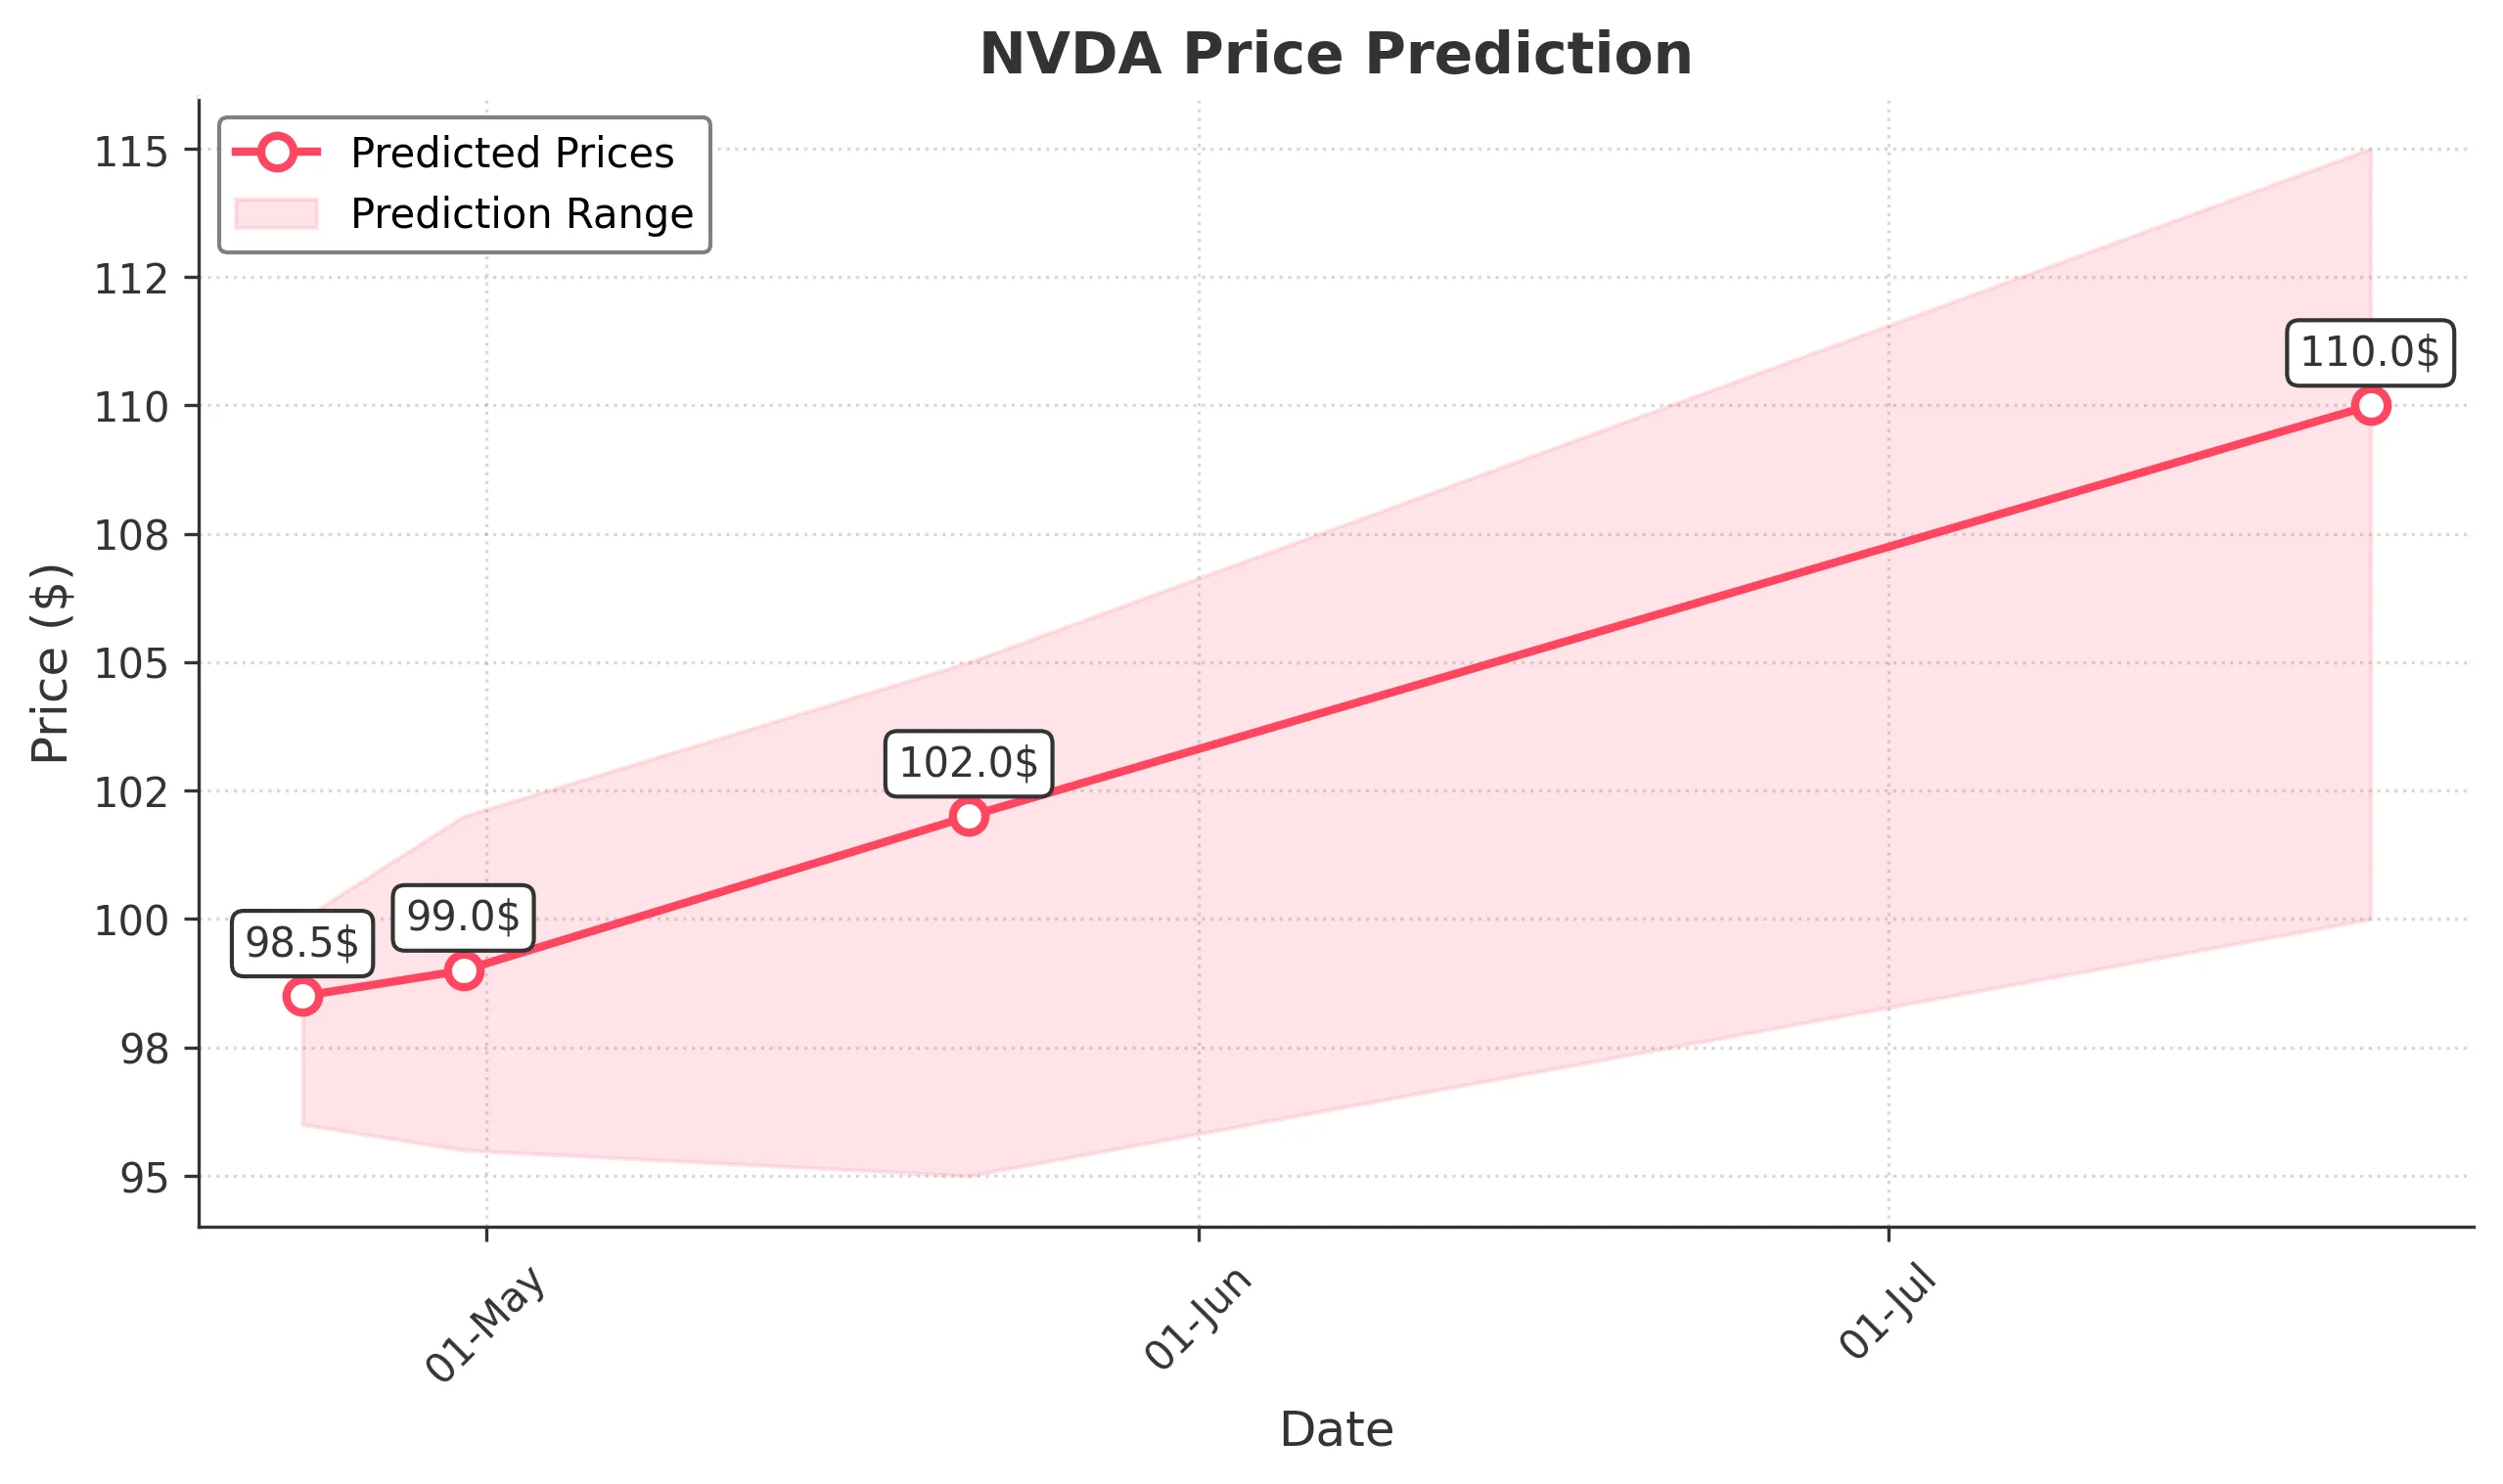
Target: April 23, 2025$98.5
$97.5
$100
$96
Description
The stock shows signs of a slight recovery after recent declines, supported by a bullish candlestick pattern. However, the RSI indicates potential overbought conditions, suggesting caution. Volume remains low, indicating weak buying interest.
Analysis
Over the past 3 months, NVDA has experienced significant volatility, with a bearish trend recently. Key support is around $95, while resistance is near $110. The MACD shows a bearish crossover, and the ATR indicates high volatility. Volume spikes were noted during sell-offs, suggesting strong selling pressure.
Confidence Level
Potential Risks
Market volatility and external news could impact the prediction. A sudden downturn is possible if selling pressure increases.
1 Week Prediction
Target: April 30, 2025$99
$98
$102
$95.5
Description
A potential rebound is anticipated as the stock approaches key support levels. The Bollinger Bands indicate a squeeze, suggesting a breakout may occur. However, the overall trend remains bearish, and caution is advised.
Analysis
The stock has been in a bearish phase, with significant declines noted. Support at $95 is critical, while resistance is at $110. The RSI is nearing oversold territory, indicating a potential reversal. Volume analysis shows spikes during sell-offs, reflecting strong bearish sentiment.
Confidence Level
Potential Risks
Unforeseen macroeconomic events or earnings reports could lead to unexpected price movements. The bearish trend may continue if selling pressure persists.
1 Month Prediction
Target: May 22, 2025$102
$100
$105
$95
Description
A gradual recovery is expected as the stock stabilizes near support levels. The MACD may show signs of bullish divergence, indicating potential upward momentum. However, the overall market sentiment remains cautious.
Analysis
The stock has faced significant downward pressure, with key support at $95. The RSI indicates potential oversold conditions, while the MACD shows bearish momentum. Volume patterns suggest strong selling interest, but a potential reversal could occur if support holds.
Confidence Level
Potential Risks
Continued bearish sentiment could hinder recovery. Economic indicators and earnings reports may also impact the stock's performance.
3 Months Prediction
Target: July 22, 2025$110
$108
$115
$100
Description
A recovery trend is anticipated as the stock approaches key resistance levels. The Fibonacci retracement levels suggest potential upward movement. However, macroeconomic factors could influence market sentiment.
Analysis
The stock has shown a bearish trend recently, with significant support at $95. The MACD indicates bearish momentum, while the RSI is approaching oversold levels. Volume analysis shows spikes during sell-offs, reflecting strong bearish sentiment, but a potential recovery could emerge if key levels hold.
Confidence Level
Potential Risks
Market volatility and external economic conditions may affect the stock's trajectory. A failure to break resistance could lead to further declines.