NVDA Trading Predictions
1 Day Prediction
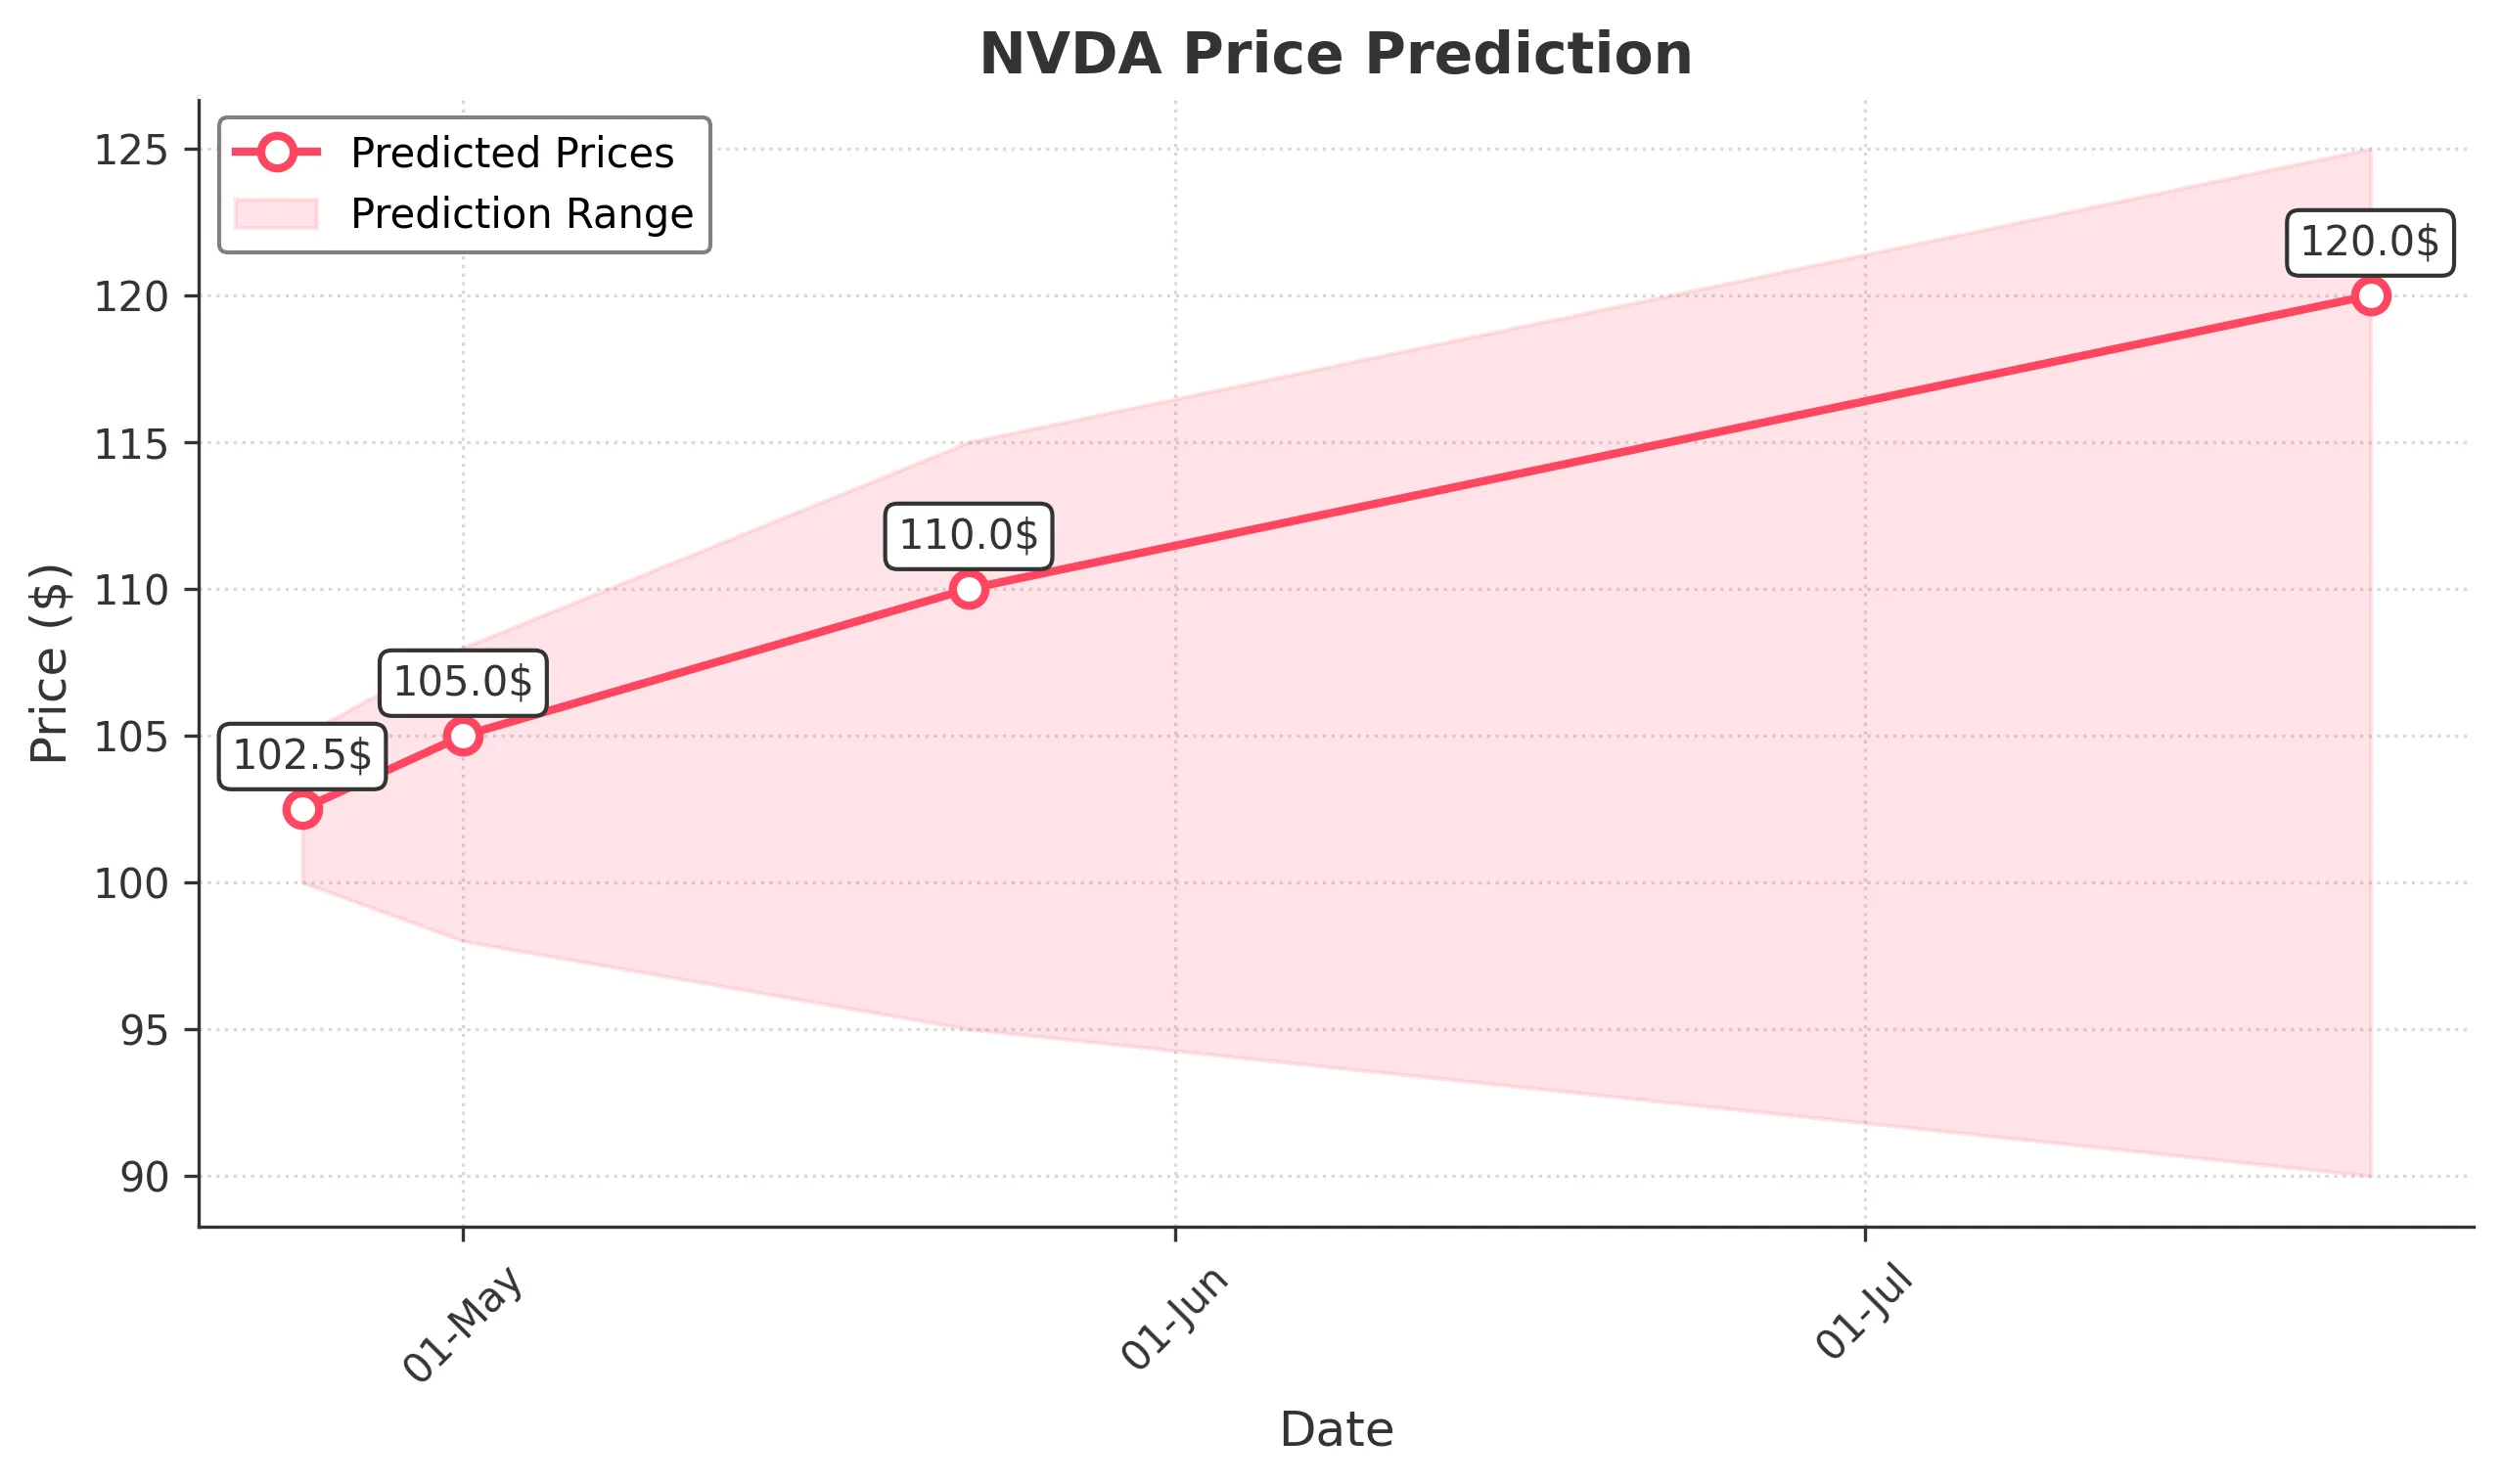
Target: April 24, 2025$102.5
$101
$105
$100
Description
The stock shows a slight recovery potential after recent declines, supported by a bullish divergence in the RSI. However, the MACD remains bearish, indicating caution. Volume is expected to be moderate as traders await clearer signals.
Analysis
Over the past 3 months, NVDA has experienced significant volatility, with a bearish trend recently. Key support is around $100, while resistance is near $110. The RSI indicates oversold conditions, but MACD suggests continued bearish momentum. Volume spikes were noted during sell-offs, indicating strong selling pressure.
Confidence Level
Potential Risks
Market volatility and external news could impact the prediction. A sudden downturn in sentiment may lead to lower prices.
1 Week Prediction
Target: May 1, 2025$105
$102
$108
$98
Description
A potential rebound is anticipated as the stock approaches key support levels. The Bollinger Bands suggest a squeeze, indicating a possible breakout. However, the overall trend remains bearish, and caution is advised.
Analysis
The stock has been in a bearish phase, with significant price drops. Support at $100 is critical, while resistance is at $110. The ATR indicates high volatility, and recent volume spikes suggest strong selling. The market sentiment is cautious, with traders wary of further declines.
Confidence Level
Potential Risks
Unforeseen macroeconomic events or earnings reports could lead to volatility. The bearish trend may continue if selling pressure persists.
1 Month Prediction
Target: May 23, 2025$110
$105
$115
$95
Description
A gradual recovery is expected as the stock stabilizes near support levels. The RSI may recover from oversold conditions, and a bullish reversal pattern could form. However, macroeconomic factors remain a concern.
Analysis
The stock has shown significant volatility, with a bearish trend dominating. Key support at $100 and resistance at $110 are critical. The RSI indicates oversold conditions, but the MACD remains bearish. Volume patterns suggest strong selling pressure, and external factors could influence future performance.
Confidence Level
Potential Risks
Economic indicators and earnings reports could significantly impact the stock's performance. The potential for further declines exists if market sentiment worsens.
3 Months Prediction
Target: July 23, 2025$120
$115
$125
$90
Description
A potential recovery trend may emerge as the stock finds support. The MACD could turn bullish, and the RSI may stabilize. However, external economic factors could hinder growth.
Analysis
The stock has faced significant challenges, with a bearish trend prevailing. Support at $100 is crucial, while resistance is at $110. The ATR indicates high volatility, and recent volume spikes suggest strong selling. Market sentiment remains cautious, with traders closely monitoring economic indicators.
Confidence Level
Potential Risks
Market volatility and economic uncertainties could lead to unexpected price movements. The bearish trend may resume if selling pressure continues.