NVDA Trading Predictions
1 Day Prediction
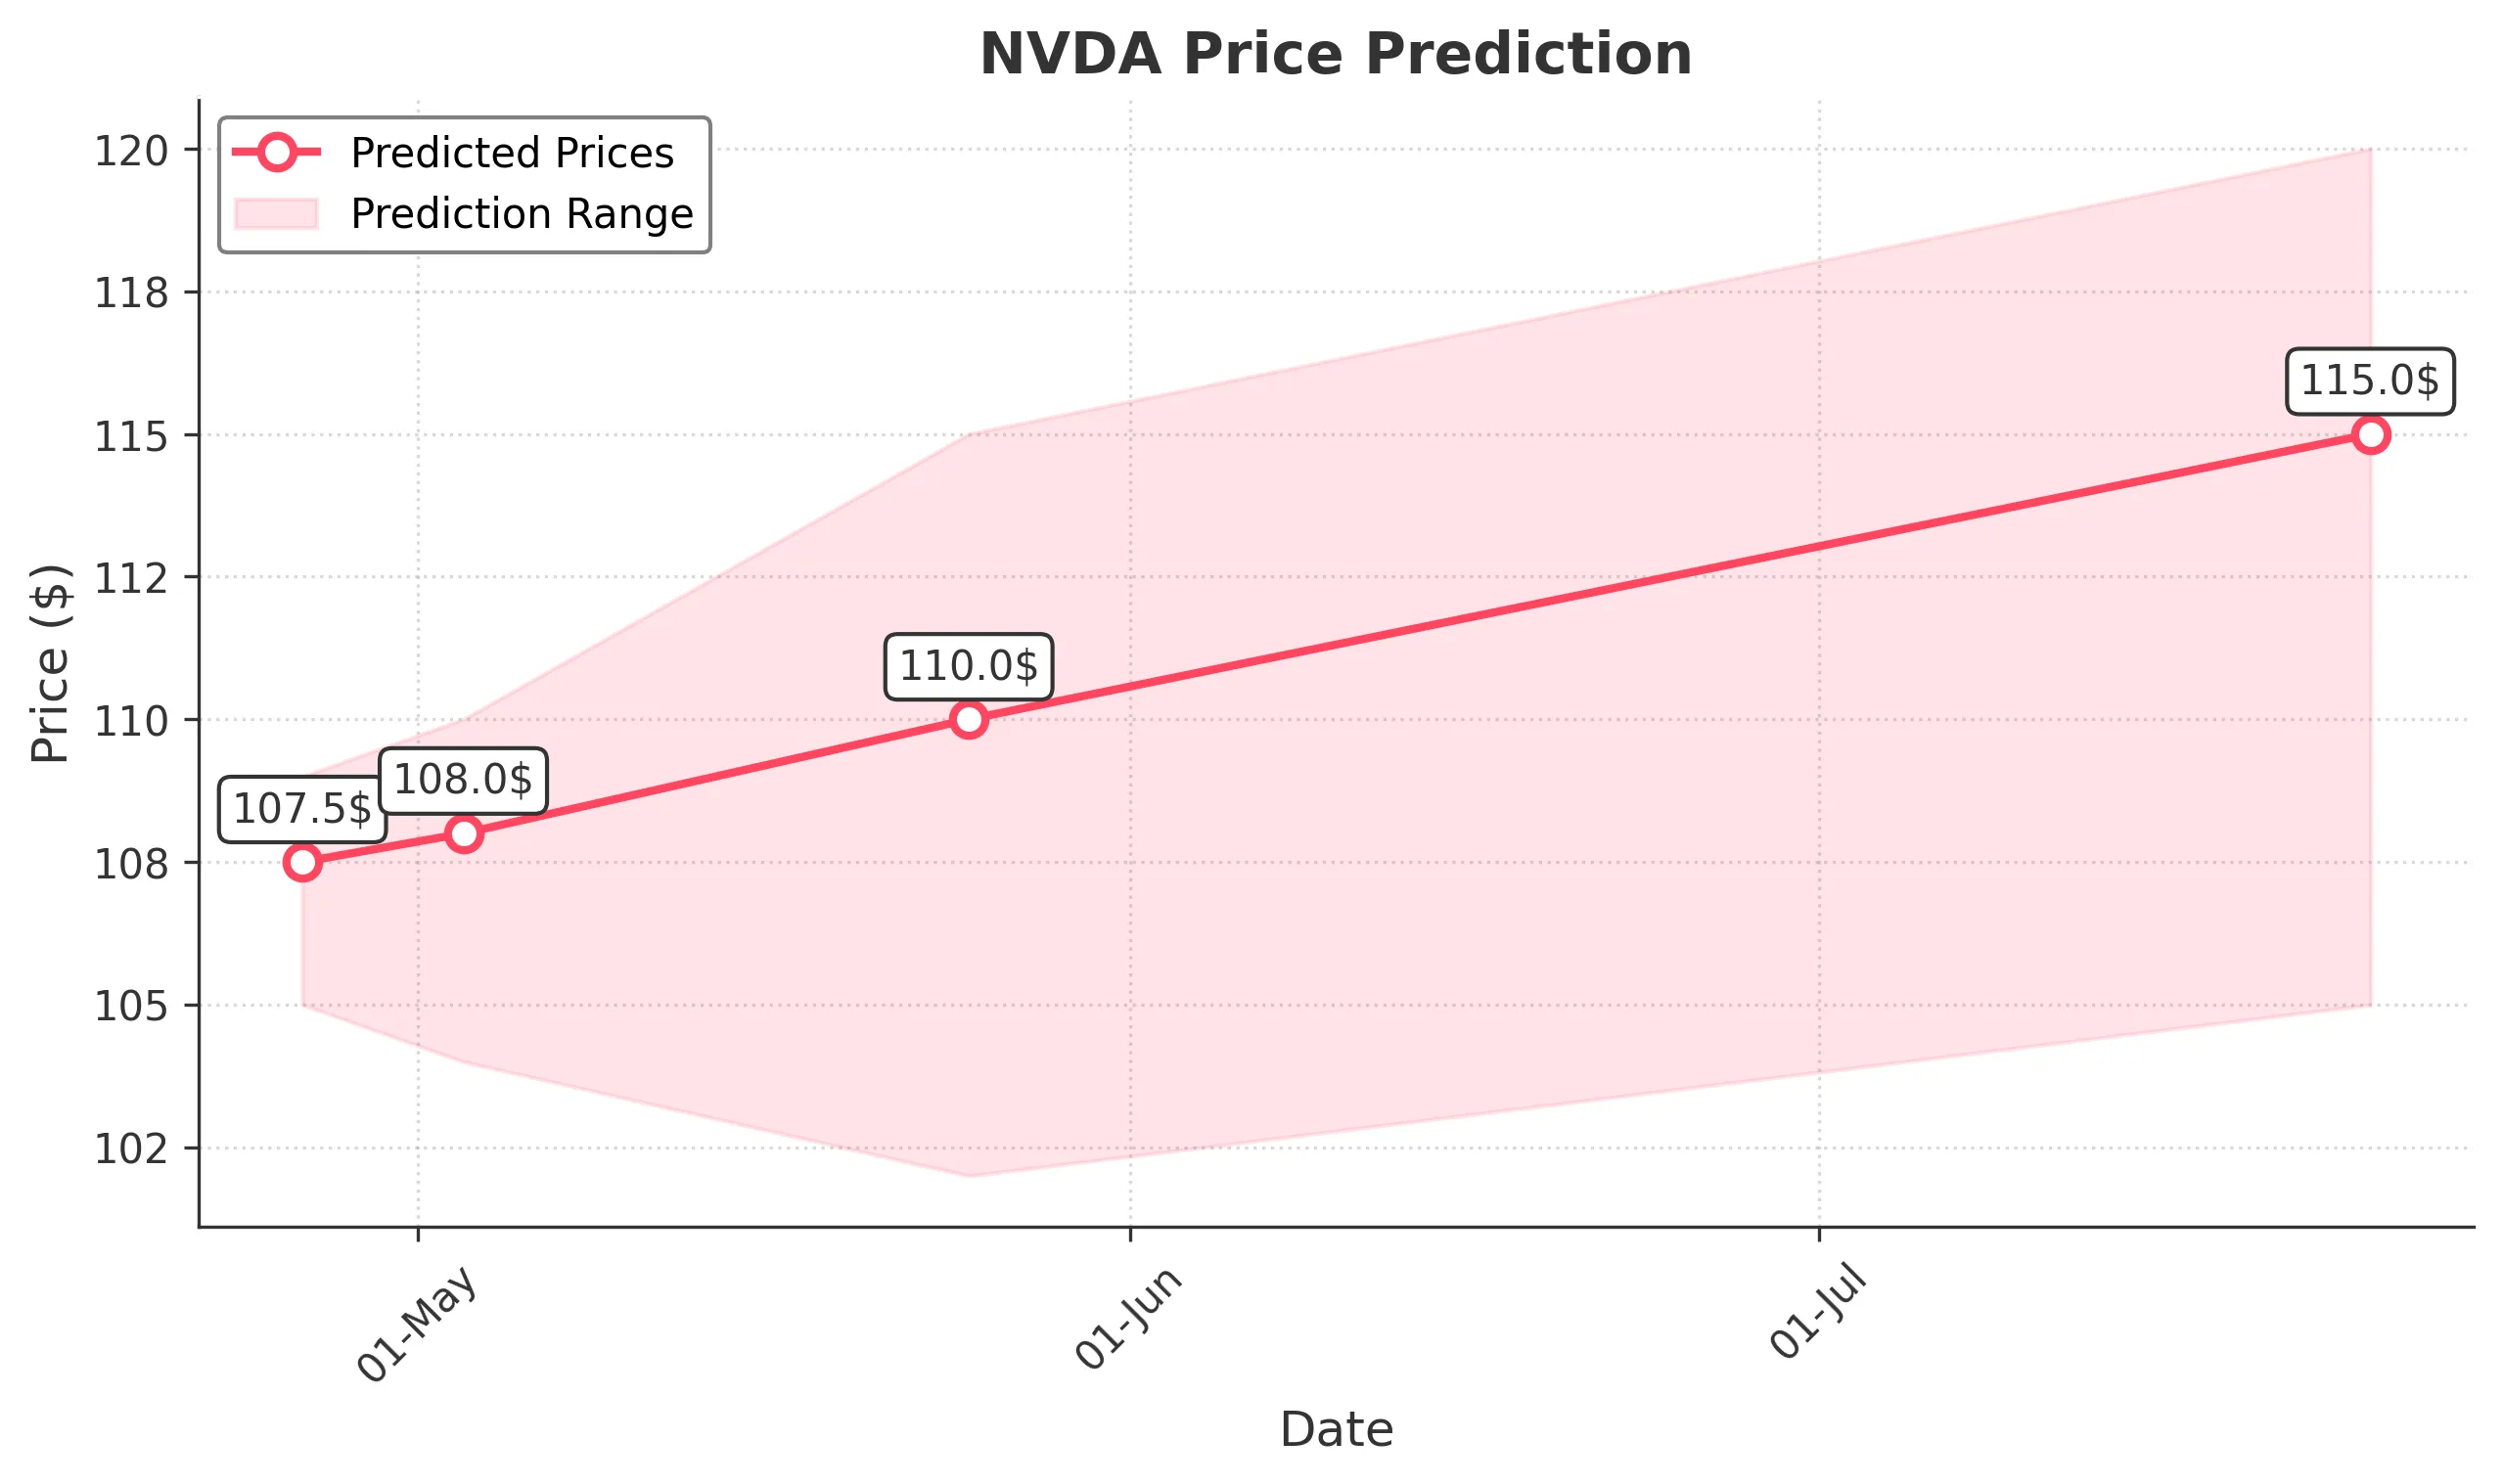
Target: April 26, 2025$107.5
$106.5
$109
$105
Description
The stock shows a slight bullish trend with a potential bounce from recent lows. RSI indicates oversold conditions, while MACD is showing a bullish crossover. However, volatility remains high, suggesting caution.
Analysis
Over the past 3 months, NVDA has experienced significant volatility, with a bearish trend recently. Key support at $100 has held, but resistance at $110 remains strong. Volume spikes indicate potential reversals, but overall sentiment is cautious.
Confidence Level
Potential Risks
Market sentiment could shift quickly due to external news or earnings reports, which may impact the prediction.
1 Week Prediction
Target: May 3, 2025$108
$107
$110
$104
Description
Expect a slight recovery as the stock tests resistance levels. The recent candlestick patterns suggest indecision, but a bullish sentiment may prevail if volume increases. Watch for external market influences.
Analysis
The stock has been in a bearish phase, with significant resistance at $110. Recent volume patterns show increased selling pressure, but a potential reversal could occur if support holds. Technical indicators are mixed, indicating uncertainty.
Confidence Level
Potential Risks
Potential for further declines if market conditions worsen or if earnings disappoint, which could lead to increased volatility.
1 Month Prediction
Target: May 25, 2025$110
$108
$115
$102
Description
A gradual recovery is anticipated as the stock approaches key resistance levels. The RSI is moving towards neutral, indicating potential for upward momentum. However, macroeconomic factors could impact performance.
Analysis
The stock has shown a bearish trend recently, with significant support at $100. Technical indicators suggest a potential reversal, but external factors could hinder recovery. Volume analysis indicates cautious trading behavior.
Confidence Level
Potential Risks
Economic indicators and earnings reports could lead to unexpected volatility, affecting the stock's trajectory.
3 Months Prediction
Target: July 25, 2025$115
$112
$120
$105
Description
Longer-term outlook suggests a recovery towards $115, driven by potential positive earnings and market sentiment. However, resistance at $120 could pose challenges. Monitor macroeconomic developments closely.
Analysis
The stock has faced significant challenges in the past months, with a bearish trend dominating. Key resistance levels at $120 and support at $100 are critical. Technical indicators show mixed signals, indicating potential for both upward and downward movements.
Confidence Level
Potential Risks
Unforeseen market events or economic downturns could derail the recovery, leading to increased volatility.