NVDA Trading Predictions
1 Day Prediction
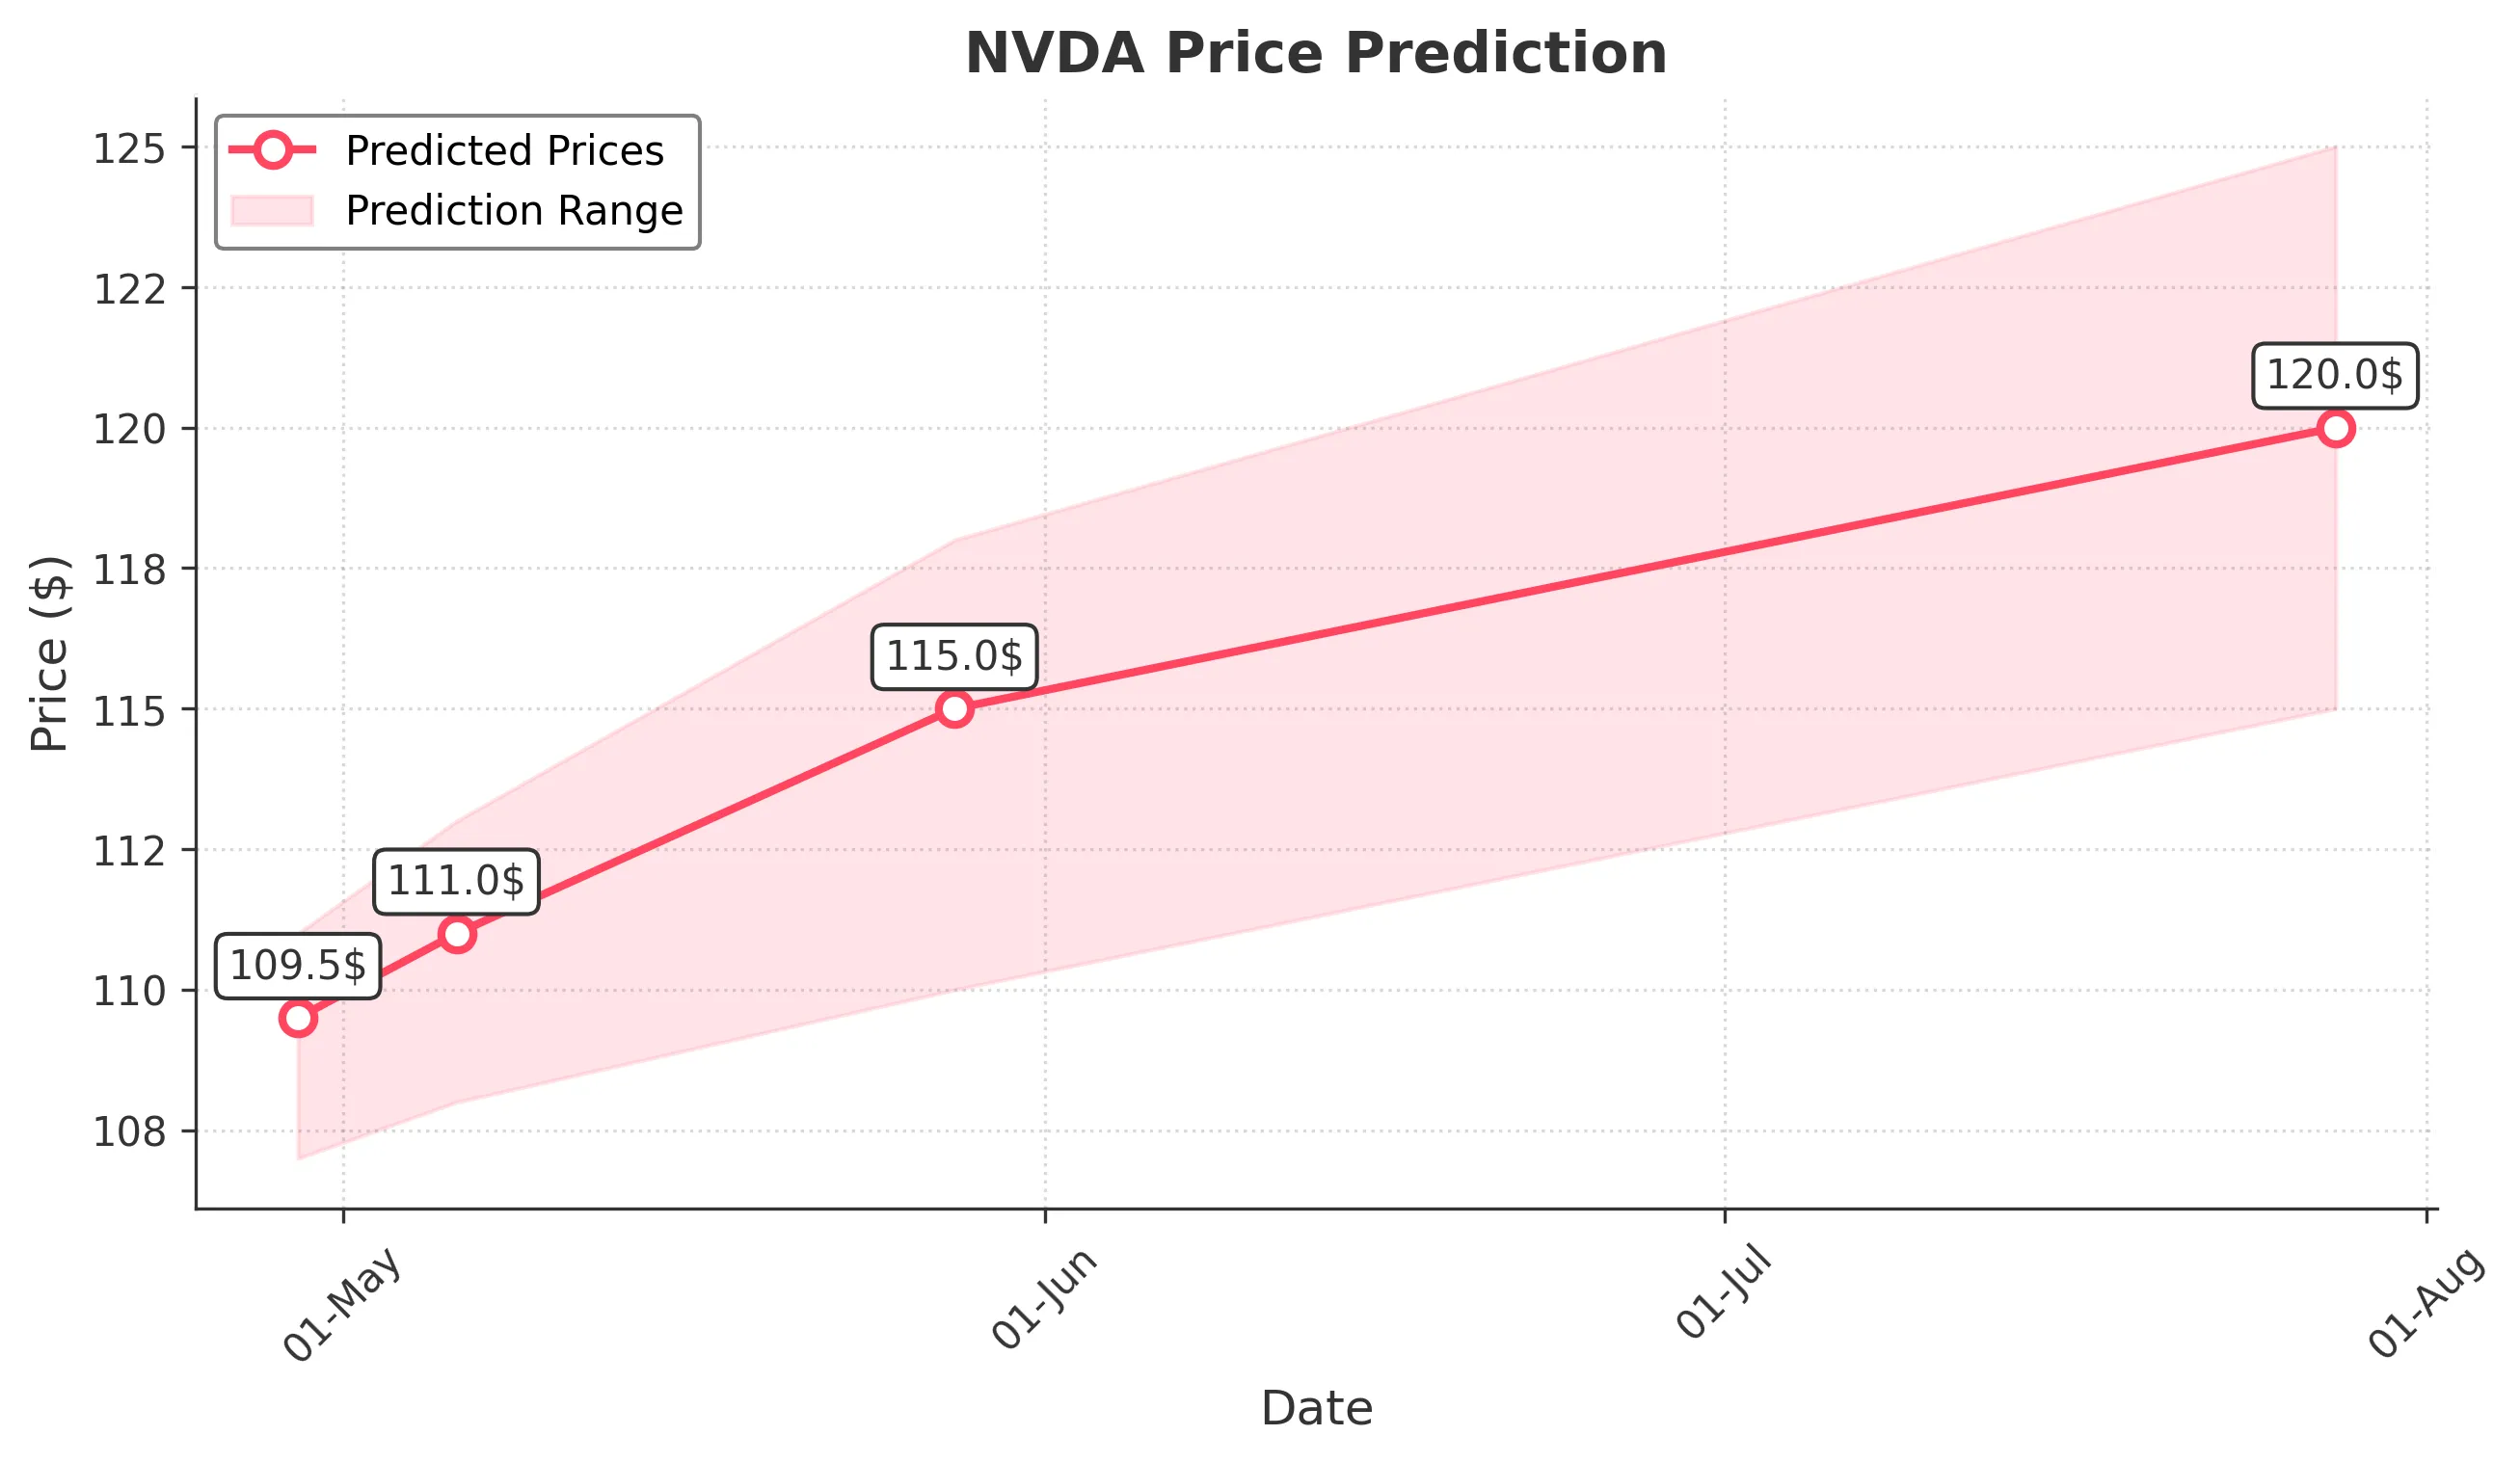
Target: April 29, 2025$109.5
$108.5
$111
$107
Description
The stock shows a slight bullish trend with a potential bounce from recent lows. RSI indicates oversold conditions, while MACD is showing a bullish crossover. However, volatility remains high, suggesting caution.
Analysis
Over the past 3 months, NVDA has experienced significant volatility, with a bearish trend recently. Key support at $100 has held, but resistance at $110 remains strong. Volume spikes indicate potential reversals, but overall sentiment is cautious.
Confidence Level
Potential Risks
Market sentiment could shift quickly due to macroeconomic news or earnings reports, which may impact the prediction.
1 Week Prediction
Target: May 6, 2025$111
$109.5
$113
$108
Description
A potential recovery is indicated as the stock approaches key resistance levels. The recent bullish candlestick patterns suggest upward momentum, but external factors could lead to volatility.
Analysis
The stock has shown a bearish trend recently, but signs of recovery are emerging. Key resistance at $110 and support at $100 are critical. Technical indicators suggest a possible reversal, but market sentiment remains mixed.
Confidence Level
Potential Risks
Uncertainty in the broader market and potential earnings surprises could lead to unexpected price movements.
1 Month Prediction
Target: May 28, 2025$115
$112
$118
$110
Description
If the bullish trend continues, NVDA could reach $115, supported by positive market sentiment and technical indicators. However, resistance levels may hinder upward movement.
Analysis
The stock has been volatile, with a recent bearish trend. However, potential bullish signals are emerging. Key resistance at $115 and support at $100 are crucial. Volume patterns suggest cautious optimism, but risks remain.
Confidence Level
Potential Risks
Market volatility and external economic factors could impact the stock's performance significantly.
3 Months Prediction
Target: July 28, 2025$120
$118
$125
$115
Description
If the current recovery trend continues, NVDA could reach $120, driven by improving market conditions and strong technical indicators. However, external factors could lead to volatility.
Analysis
The stock has shown a bearish trend recently, but signs of recovery are emerging. Key resistance at $120 and support at $100 are critical. Technical indicators suggest a possible reversal, but market sentiment remains mixed.
Confidence Level
Potential Risks
Potential market corrections and economic uncertainties could significantly affect the stock's trajectory.