NVDA Trading Predictions
1 Day Prediction
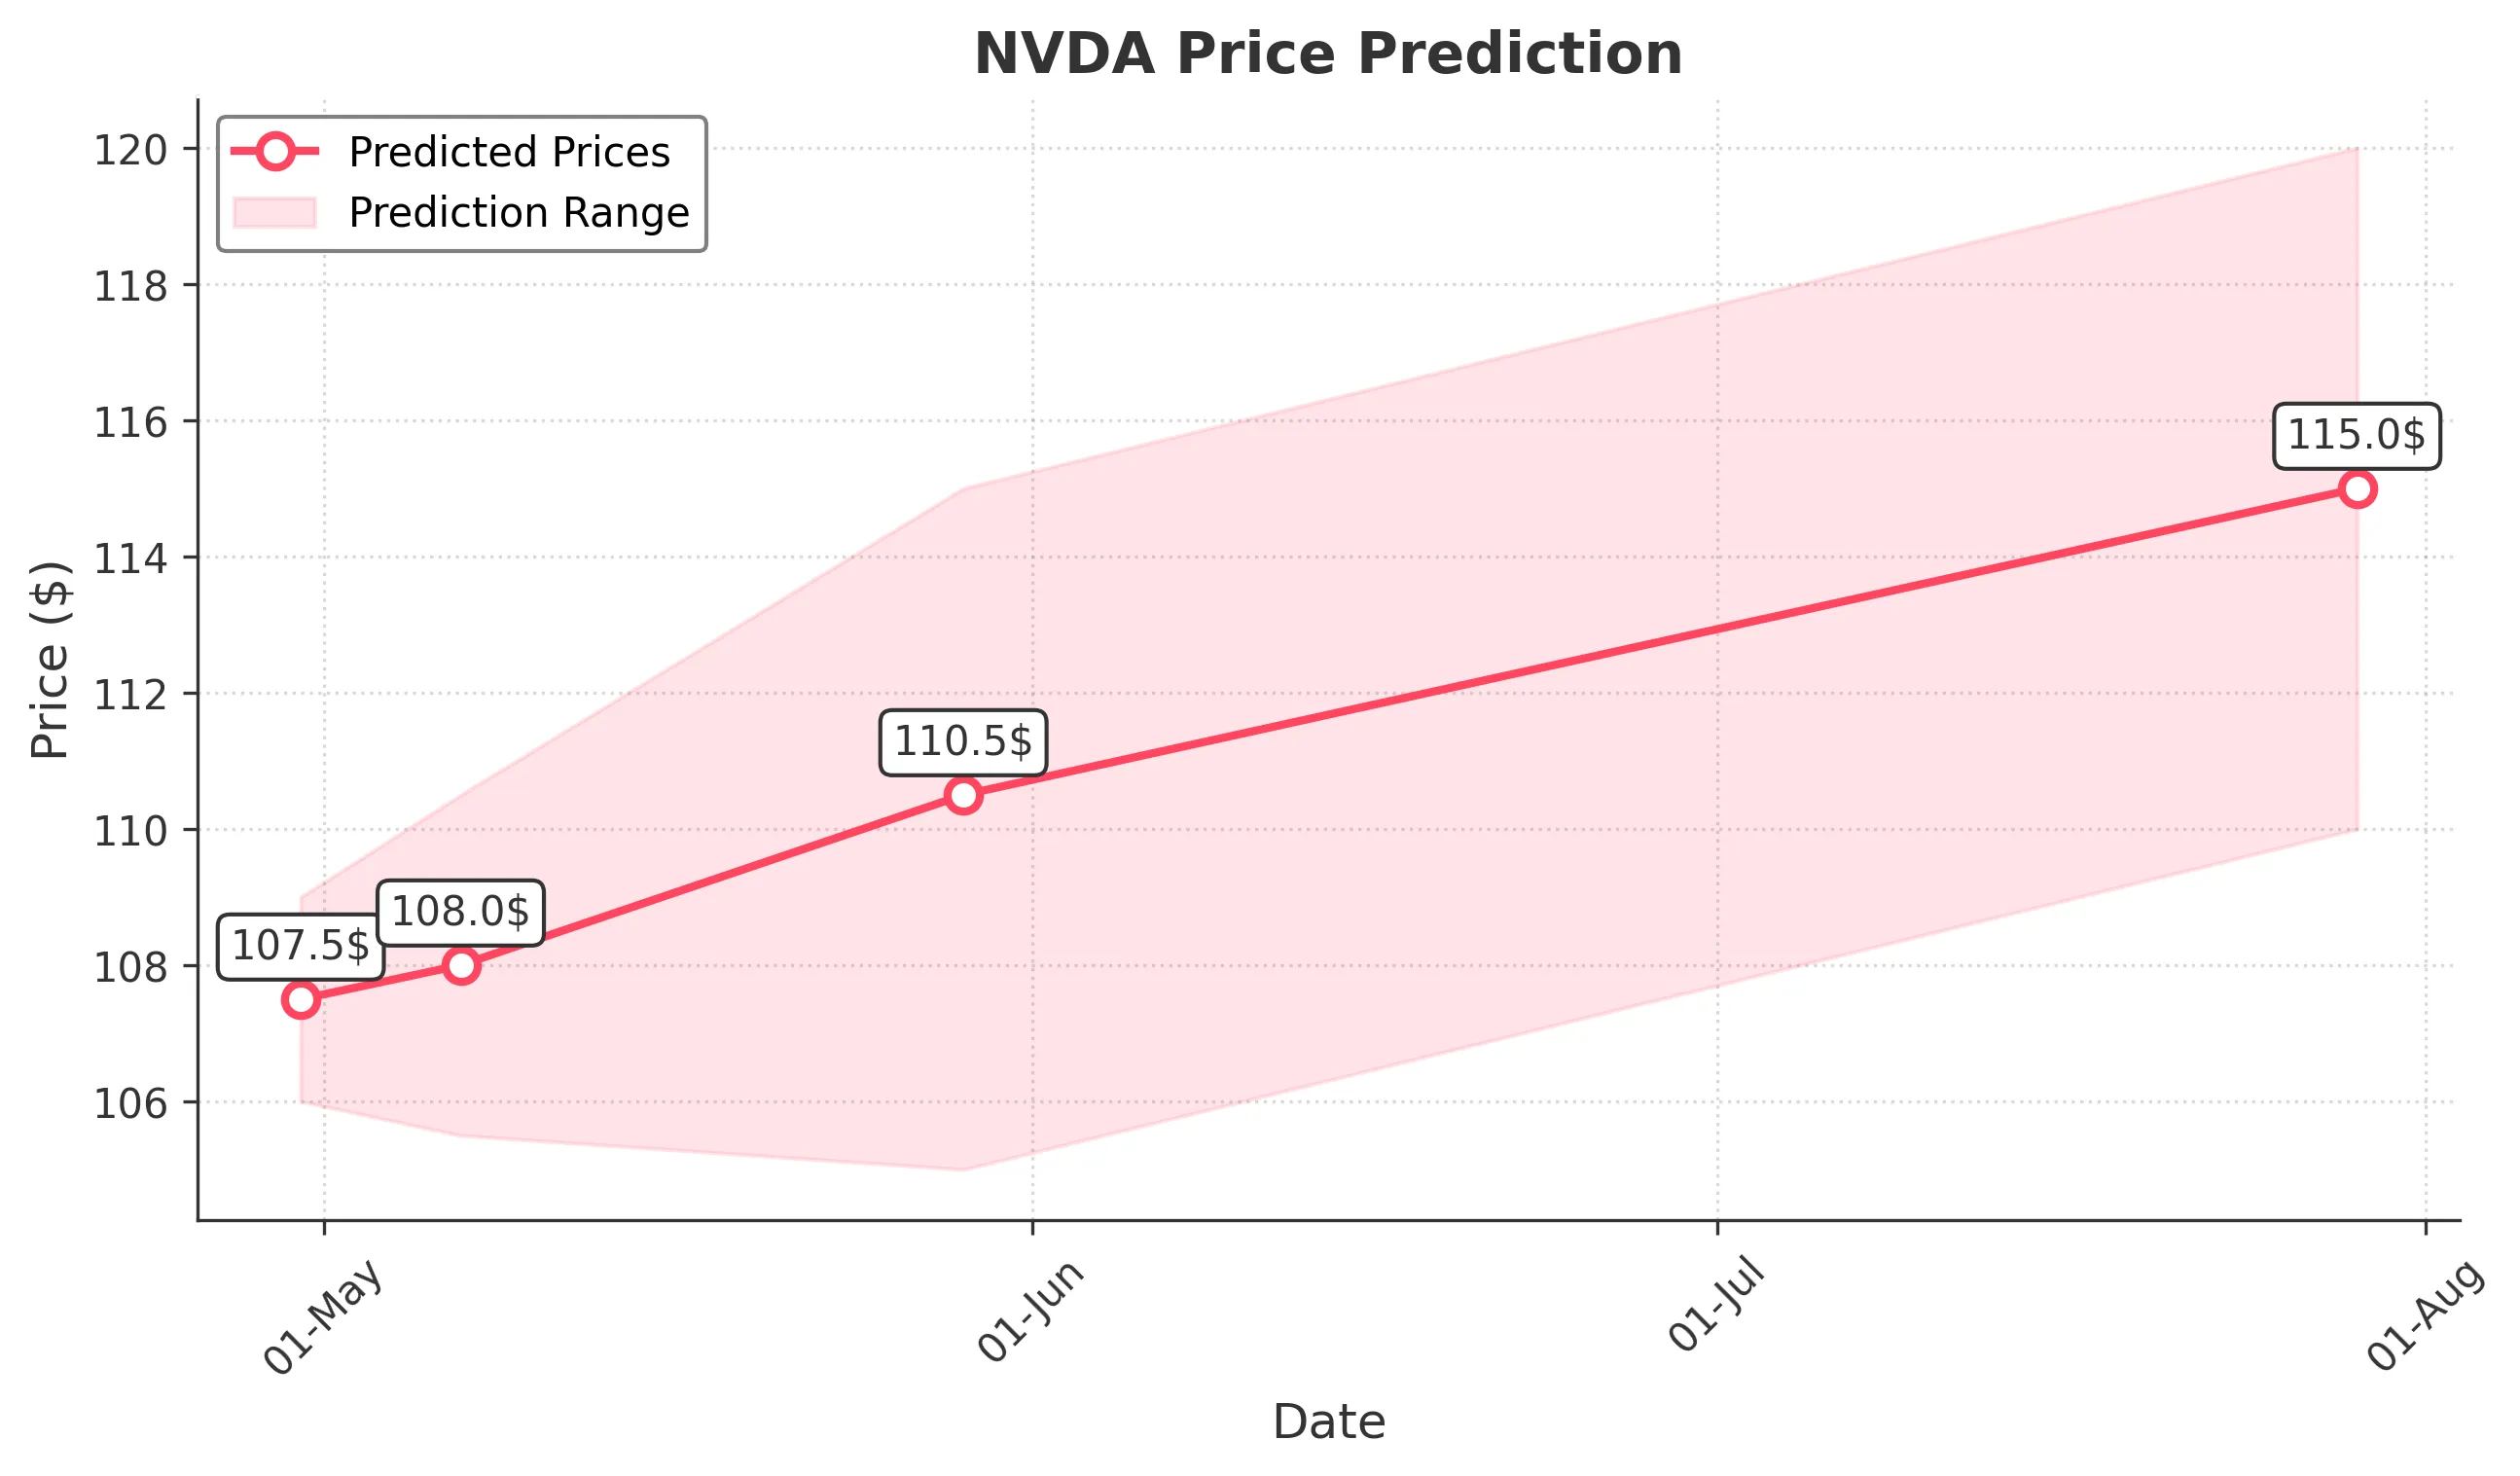
Target: April 30, 2025$107.5
$107
$109
$106
Description
The stock shows a slight bullish trend with a potential close around 107.500. The recent candlestick patterns indicate indecision, while the RSI is near neutral. Volume is expected to be lower as market sentiment remains cautious.
Analysis
Over the past 3 months, NVDA has shown a bearish trend with significant fluctuations. Key support is around 100, while resistance is near 130. The RSI indicates oversold conditions, but recent volume spikes suggest potential reversals.
Confidence Level
Potential Risks
Market volatility and external news could impact the price significantly.
1 Week Prediction
Target: May 7, 2025$108
$107.5
$110.5
$105.5
Description
Expecting a close around 108.000 as the stock may stabilize after recent declines. The MACD shows a potential bullish crossover, but caution is advised due to overall market sentiment.
Analysis
The stock has been in a downtrend, with significant resistance at 110. Recent candlestick patterns suggest indecision, and the ATR indicates increased volatility. Volume analysis shows spikes during sell-offs, indicating bearish sentiment.
Confidence Level
Potential Risks
Unforeseen macroeconomic events could lead to increased volatility.
1 Month Prediction
Target: May 29, 2025$110.5
$109
$115
$105
Description
Predicted close of 110.500 reflects a potential recovery as the stock may find support at lower levels. The RSI is improving, indicating a possible bullish reversal, but caution is warranted.
Analysis
The stock has been volatile, with key support at 100 and resistance at 130. The recent downtrend has created a bearish sentiment, but potential bullish signals from technical indicators suggest a possible recovery.
Confidence Level
Potential Risks
Market conditions and earnings reports could significantly affect the stock's trajectory.
3 Months Prediction
Target: July 29, 2025$115
$113
$120
$110
Description
A close of 115.000 suggests a gradual recovery as the stock stabilizes. The MACD may indicate a bullish trend, but external factors could still pose risks.
Analysis
The stock has faced significant downward pressure, with key resistance at 120. The overall trend remains bearish, but potential bullish signals from technical indicators suggest a cautious optimism for recovery.
Confidence Level
Potential Risks
Economic conditions and competitive pressures could hinder recovery efforts.