NVDA Trading Predictions
1 Day Prediction
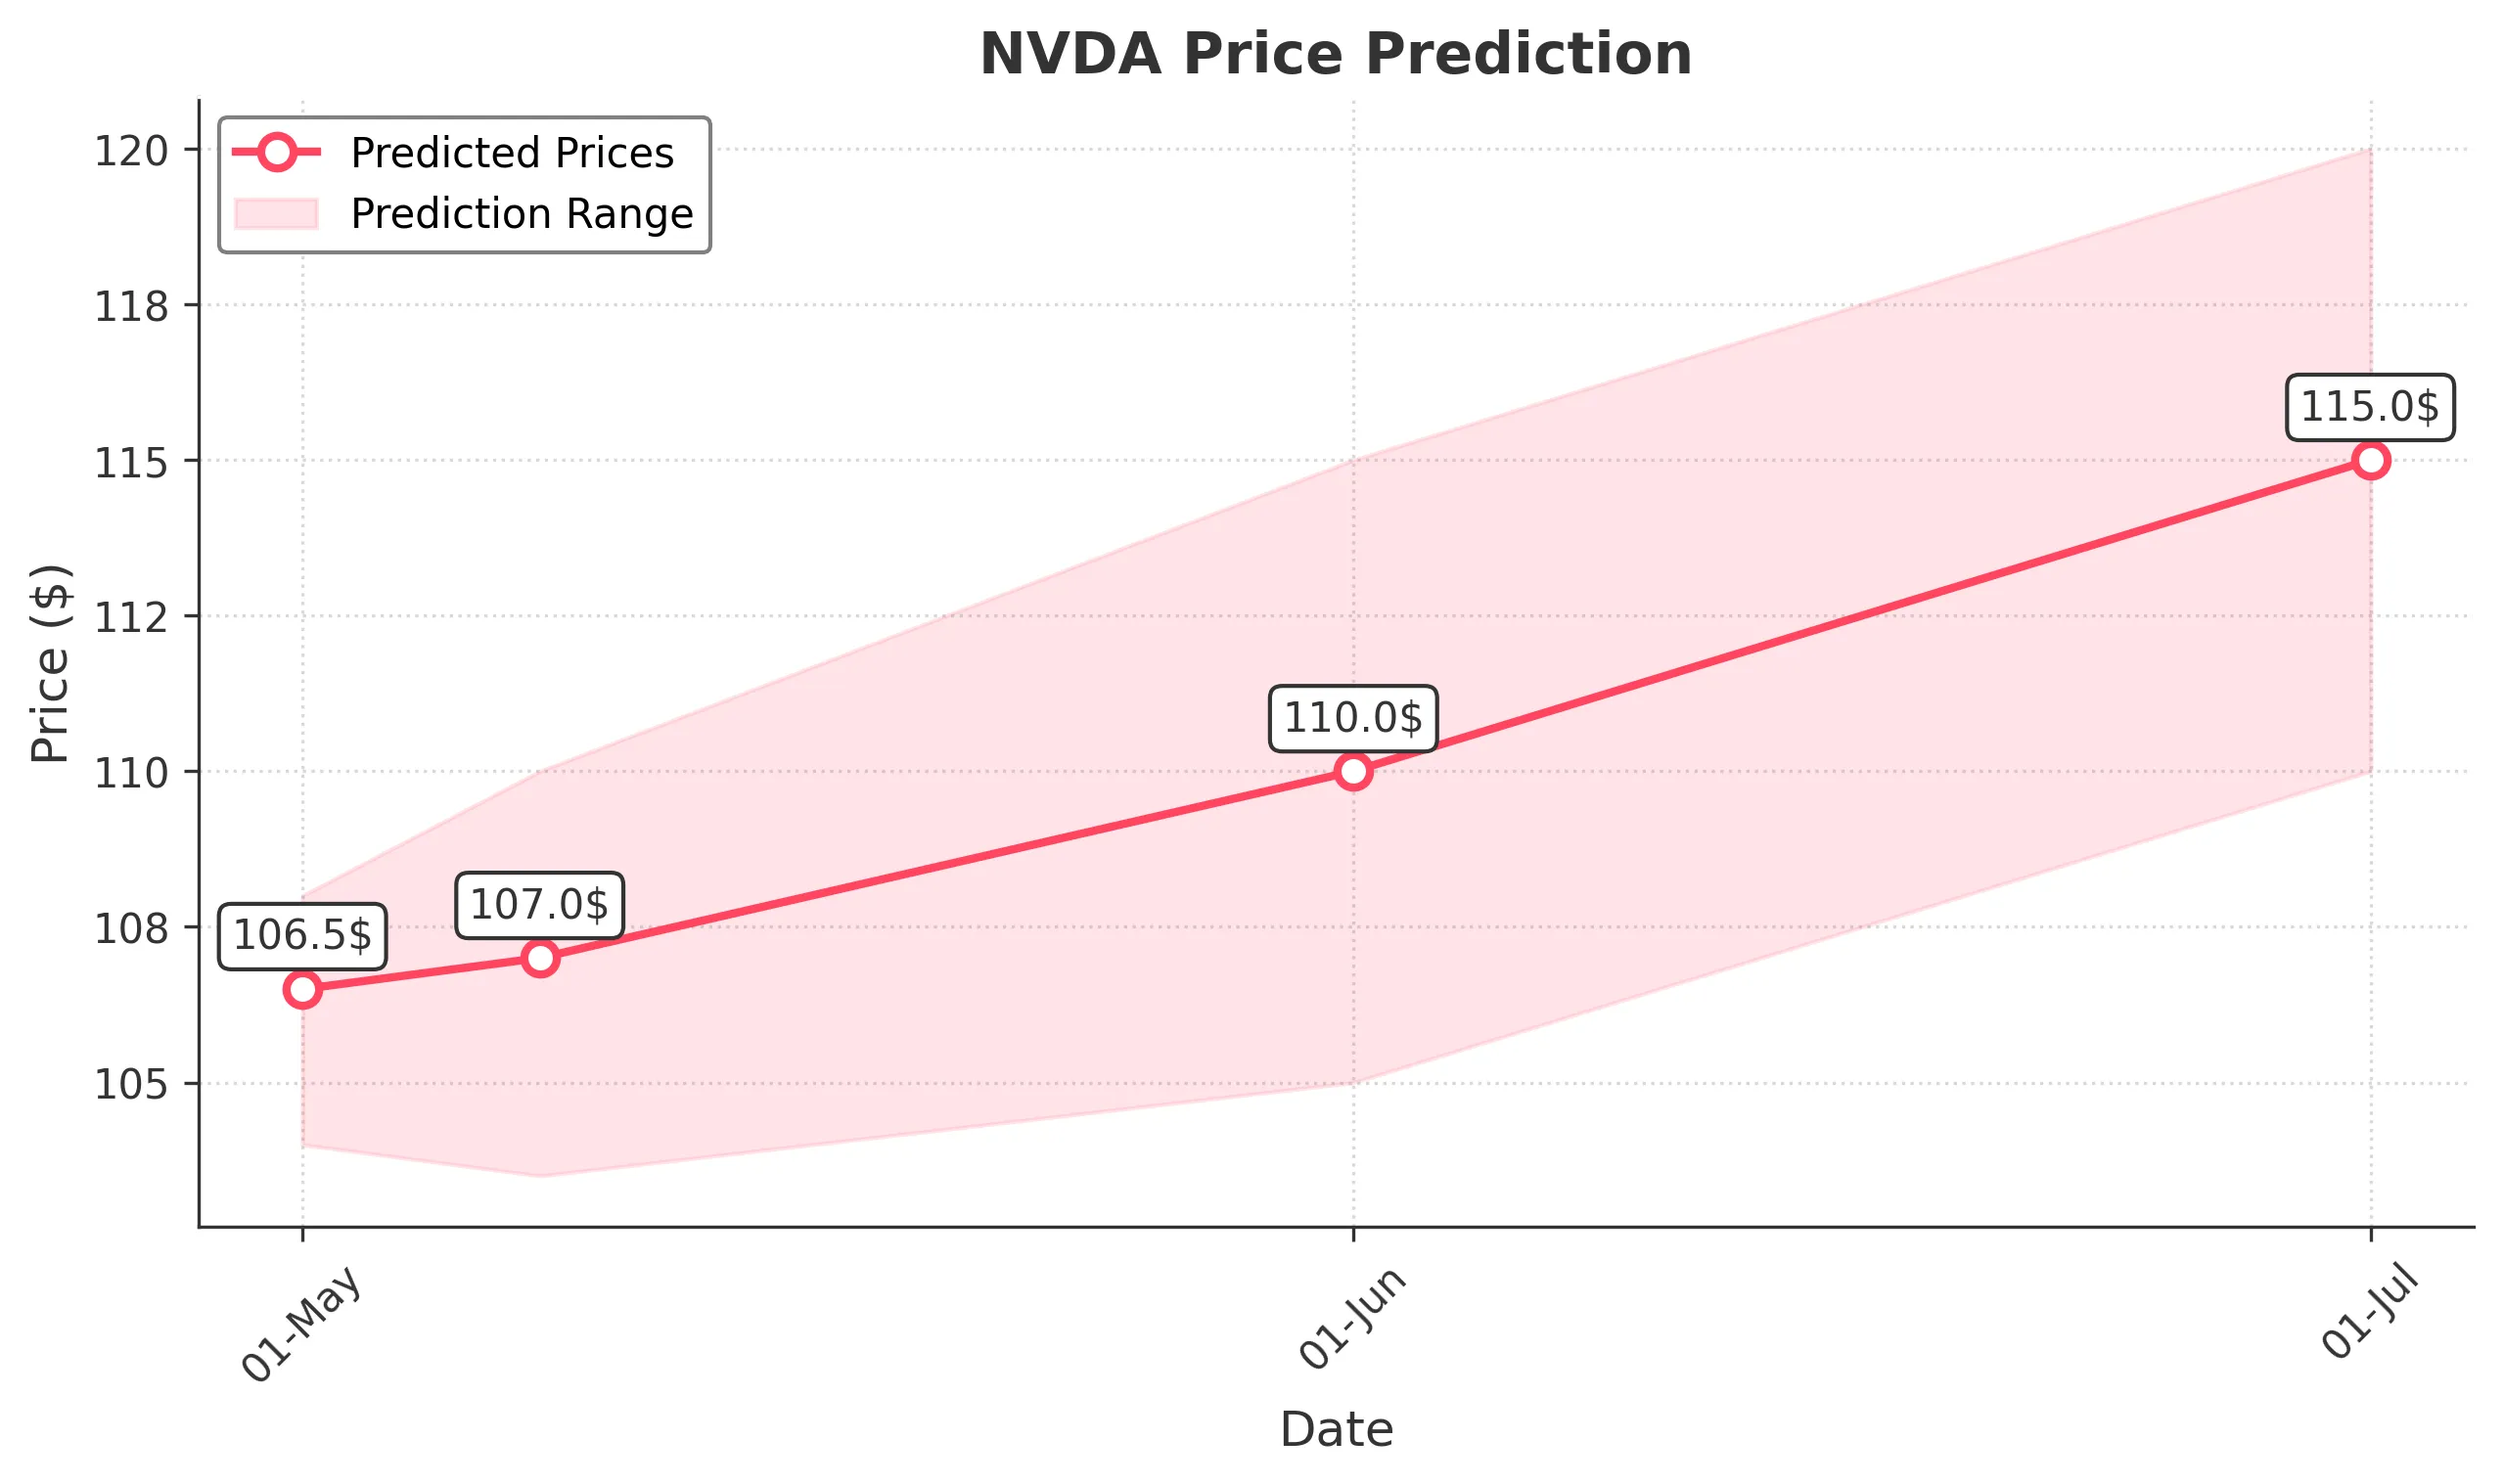
Target: May 1, 2025$106.5
$105.5
$108
$104
Description
The stock shows a slight bullish trend with a potential close around 106.500. Recent candlestick patterns indicate indecision, while RSI is neutral. Volume remains high, suggesting continued interest. However, market sentiment is cautious due to recent volatility.
Analysis
Over the past 3 months, NVDA has experienced significant volatility, with a bearish trend recently. Key support is around 100, while resistance is near 110. Technical indicators show mixed signals, with RSI fluctuating around neutral levels. Volume spikes indicate heightened trading activity, reflecting market uncertainty.
Confidence Level
Potential Risks
Market volatility and external news could impact the prediction. A sudden downturn is possible if bearish sentiment prevails.
1 Week Prediction
Target: May 8, 2025$107
$106
$110
$103.5
Description
A slight upward trend is expected, with a close around 107.000. The MACD shows a potential bullish crossover, while Bollinger Bands indicate a tightening range. However, the market remains sensitive to macroeconomic factors.
Analysis
The stock has been in a bearish phase recently, with significant price fluctuations. Support at 100 remains critical, while resistance at 110 could limit upward movement. Technical indicators are mixed, with some suggesting a potential recovery, but overall sentiment is cautious.
Confidence Level
Potential Risks
Potential for reversal exists if negative news impacts market sentiment. Watch for volume spikes that could indicate shifts in momentum.
1 Month Prediction
Target: June 1, 2025$110
$108
$115
$105
Description
Expect a gradual recovery towards 110.000 as market sentiment stabilizes. Fibonacci retracement levels suggest potential support at 105. The RSI indicates a possible bullish divergence, hinting at upward momentum.
Analysis
The past three months have shown a bearish trend with high volatility. Key support at 100 and resistance at 110 are crucial. Technical indicators suggest potential for recovery, but external factors could influence price movements significantly.
Confidence Level
Potential Risks
Economic indicators and earnings reports could sway market sentiment. A failure to break above resistance may lead to further declines.
3 Months Prediction
Target: July 1, 2025$115
$112
$120
$110
Description
A bullish outlook is anticipated with a close around 115.000, supported by improving market sentiment and potential positive earnings. The MACD indicates a bullish trend, while volume analysis shows increasing interest.
Analysis
The stock has faced significant challenges over the last three months, with a bearish trend dominating. However, signs of recovery are emerging, with key support at 100 and resistance at 120. Technical indicators suggest potential for upward movement, but caution is warranted due to external market influences.
Confidence Level
Potential Risks
Market conditions and economic data releases could alter this trajectory. A significant downturn in tech stocks could impact NVDA negatively.