NVDA Trading Predictions
1 Day Prediction
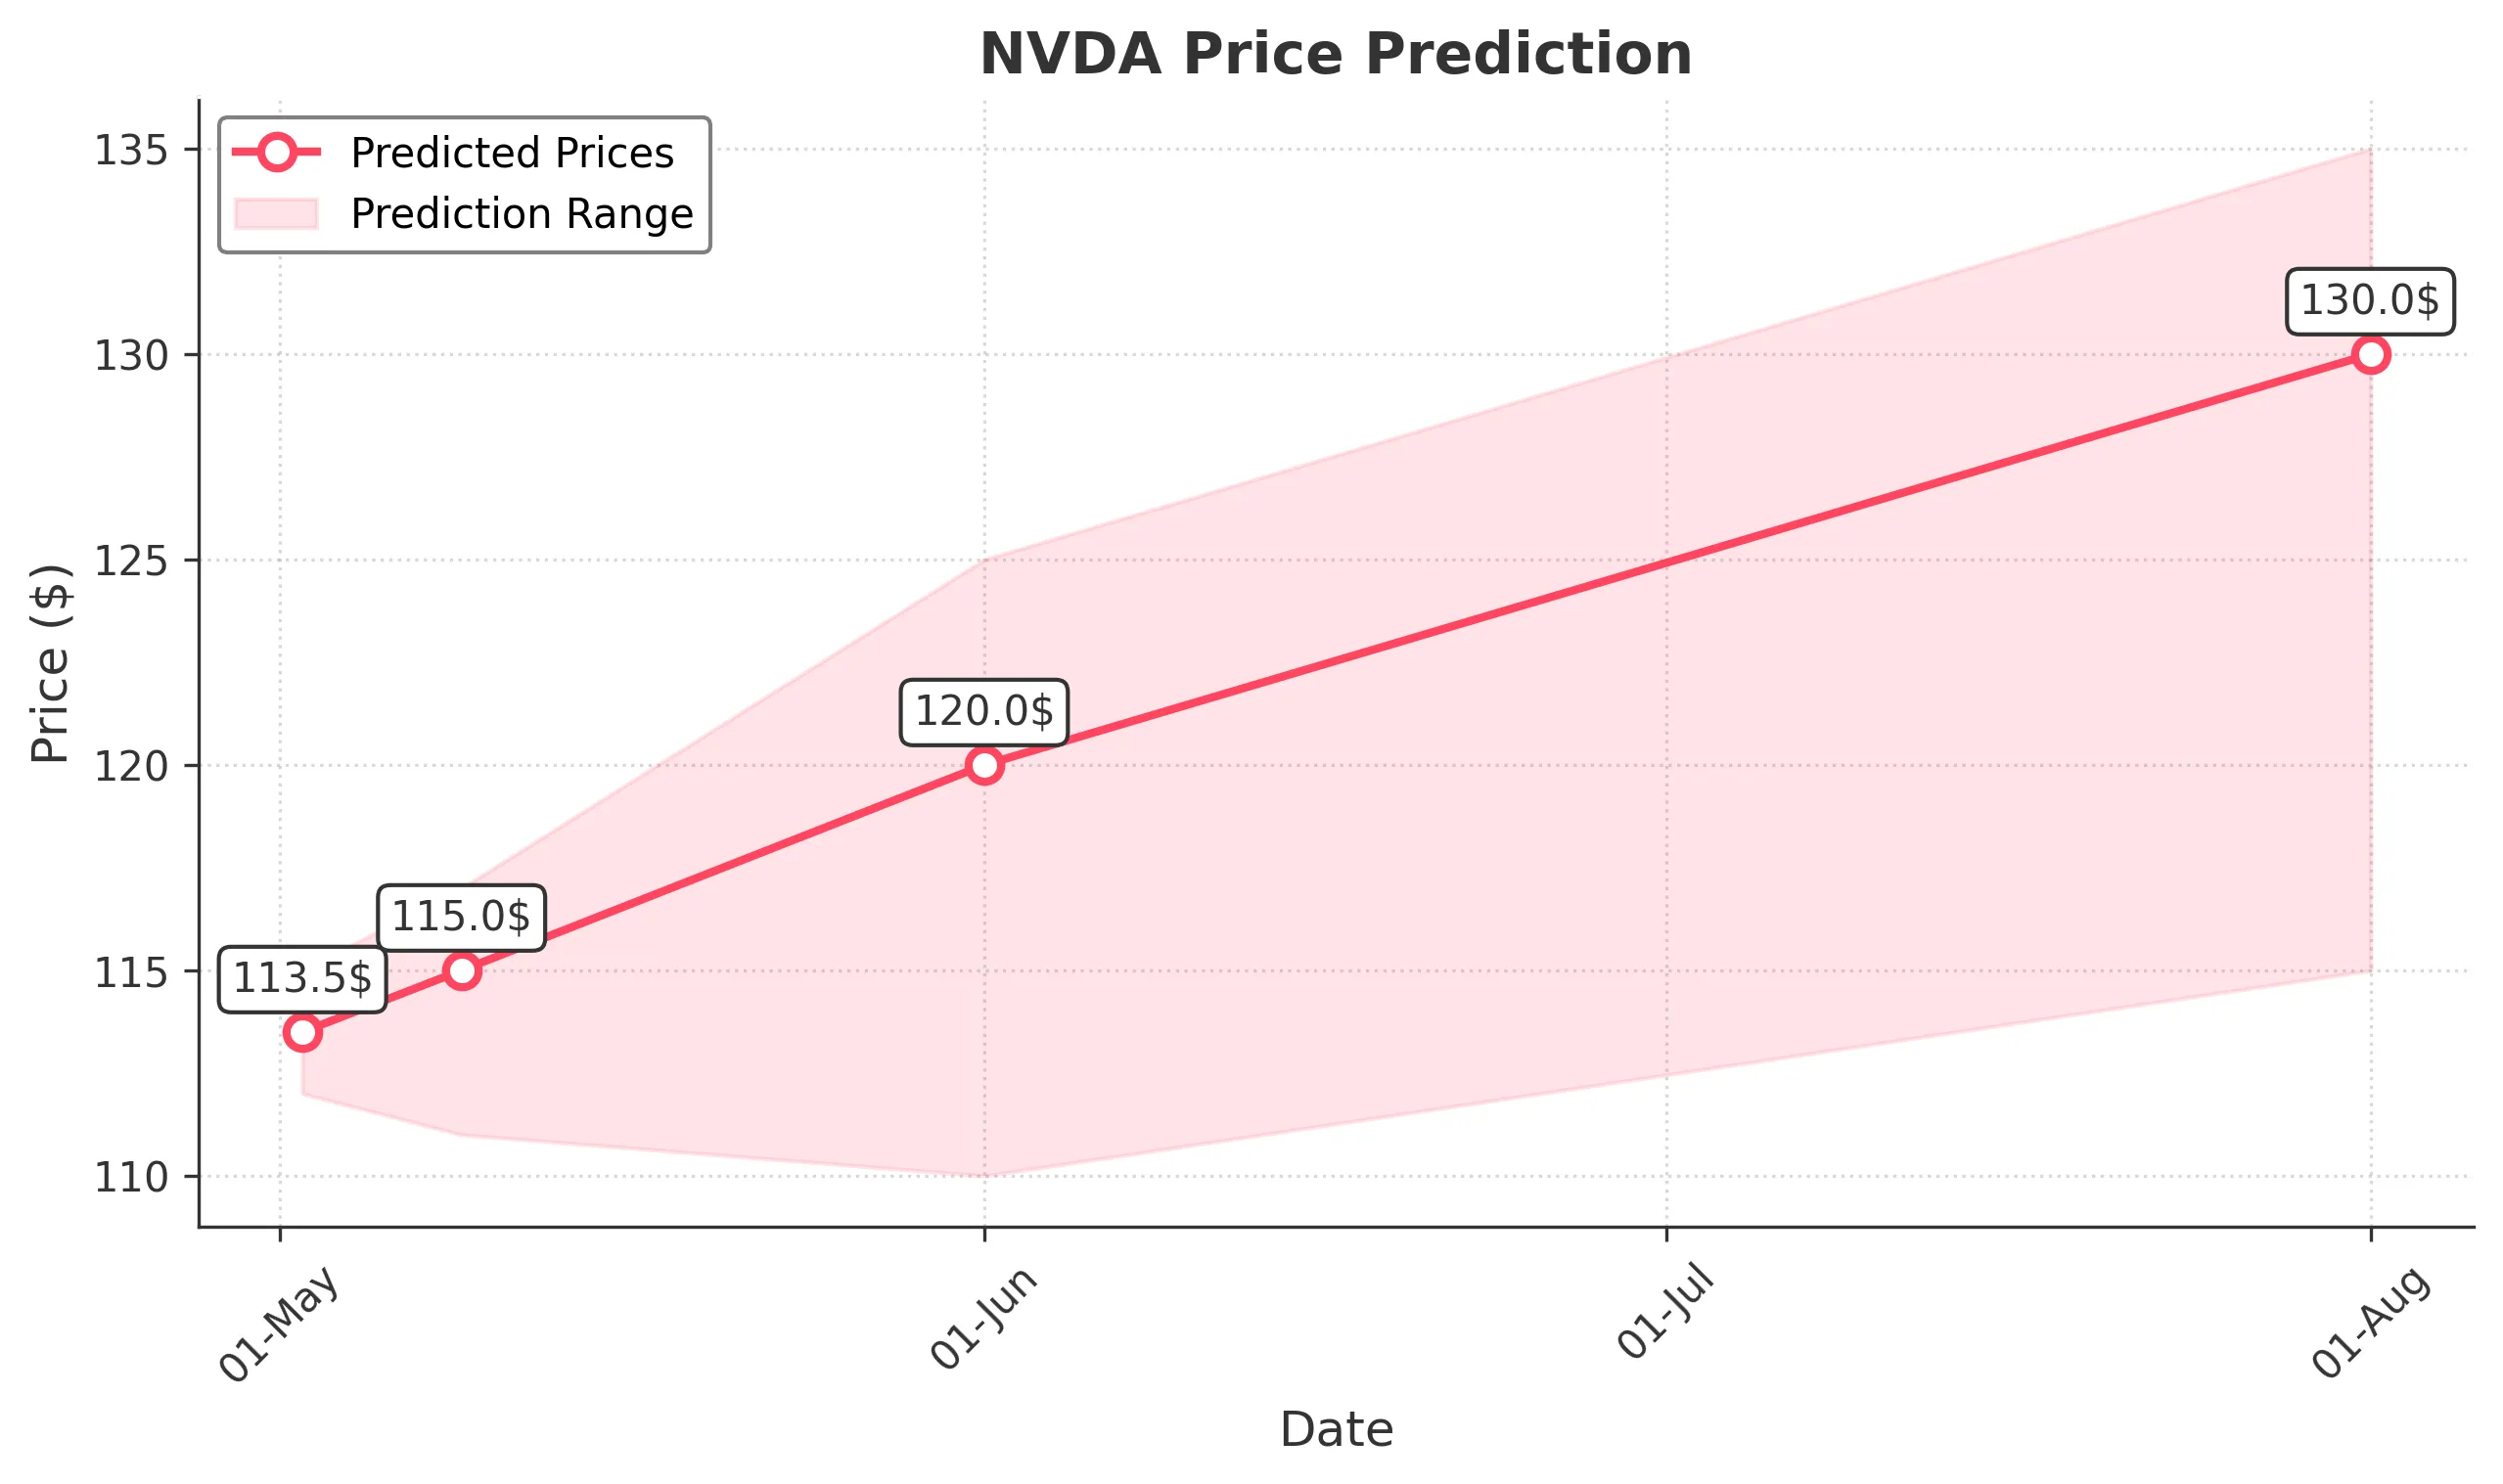
Target: May 2, 2025$113.5
$112.5
$115
$112
Description
The stock shows a slight bullish trend with a recent close above the 50-day moving average. RSI is neutral, indicating no overbought conditions. However, recent volatility suggests caution. Expect a close around 113.50.
Analysis
Over the past 3 months, NVDA has shown significant volatility, with a bearish trend recently. Key support at 100 and resistance at 140. Technical indicators like MACD are showing mixed signals. Volume spikes indicate potential reversals.
Confidence Level
Potential Risks
Market sentiment could shift due to macroeconomic news or earnings reports, which may impact the prediction.
1 Week Prediction
Target: May 9, 2025$115
$113
$117
$111
Description
Expect a slight recovery as the stock may bounce off support levels. The MACD shows potential bullish divergence, while RSI is approaching oversold territory. Anticipate a close around 115.00.
Analysis
The stock has been in a bearish phase, with significant drops in price. Key support at 100 is holding, but resistance at 140 remains strong. Volume analysis shows increased activity, indicating potential for a reversal.
Confidence Level
Potential Risks
Uncertainty in market conditions and potential earnings surprises could lead to unexpected price movements.
1 Month Prediction
Target: June 1, 2025$120
$115
$125
$110
Description
A gradual recovery is expected as the stock stabilizes. The 50-day moving average may act as support. However, macroeconomic factors could influence the market. Anticipate a close around 120.00.
Analysis
The stock has experienced significant fluctuations, with a bearish trend recently. Key support at 100 and resistance at 140 are critical. Technical indicators suggest potential for recovery, but market sentiment remains cautious.
Confidence Level
Potential Risks
Economic indicators and earnings reports could lead to volatility, impacting the stock's recovery trajectory.
3 Months Prediction
Target: August 1, 2025$130
$125
$135
$115
Description
Long-term outlook suggests a recovery towards 130.00 as market conditions stabilize. The stock may find support at 120, with potential bullish momentum if macroeconomic conditions improve.
Analysis
The stock has shown a bearish trend recently, but potential for recovery exists. Key support at 100 and resistance at 140 are critical. Technical indicators suggest a possible reversal, but market sentiment remains mixed.
Confidence Level
Potential Risks
Long-term predictions are subject to market volatility and external economic factors that could alter the trajectory.