NVDA Trading Predictions
1 Day Prediction
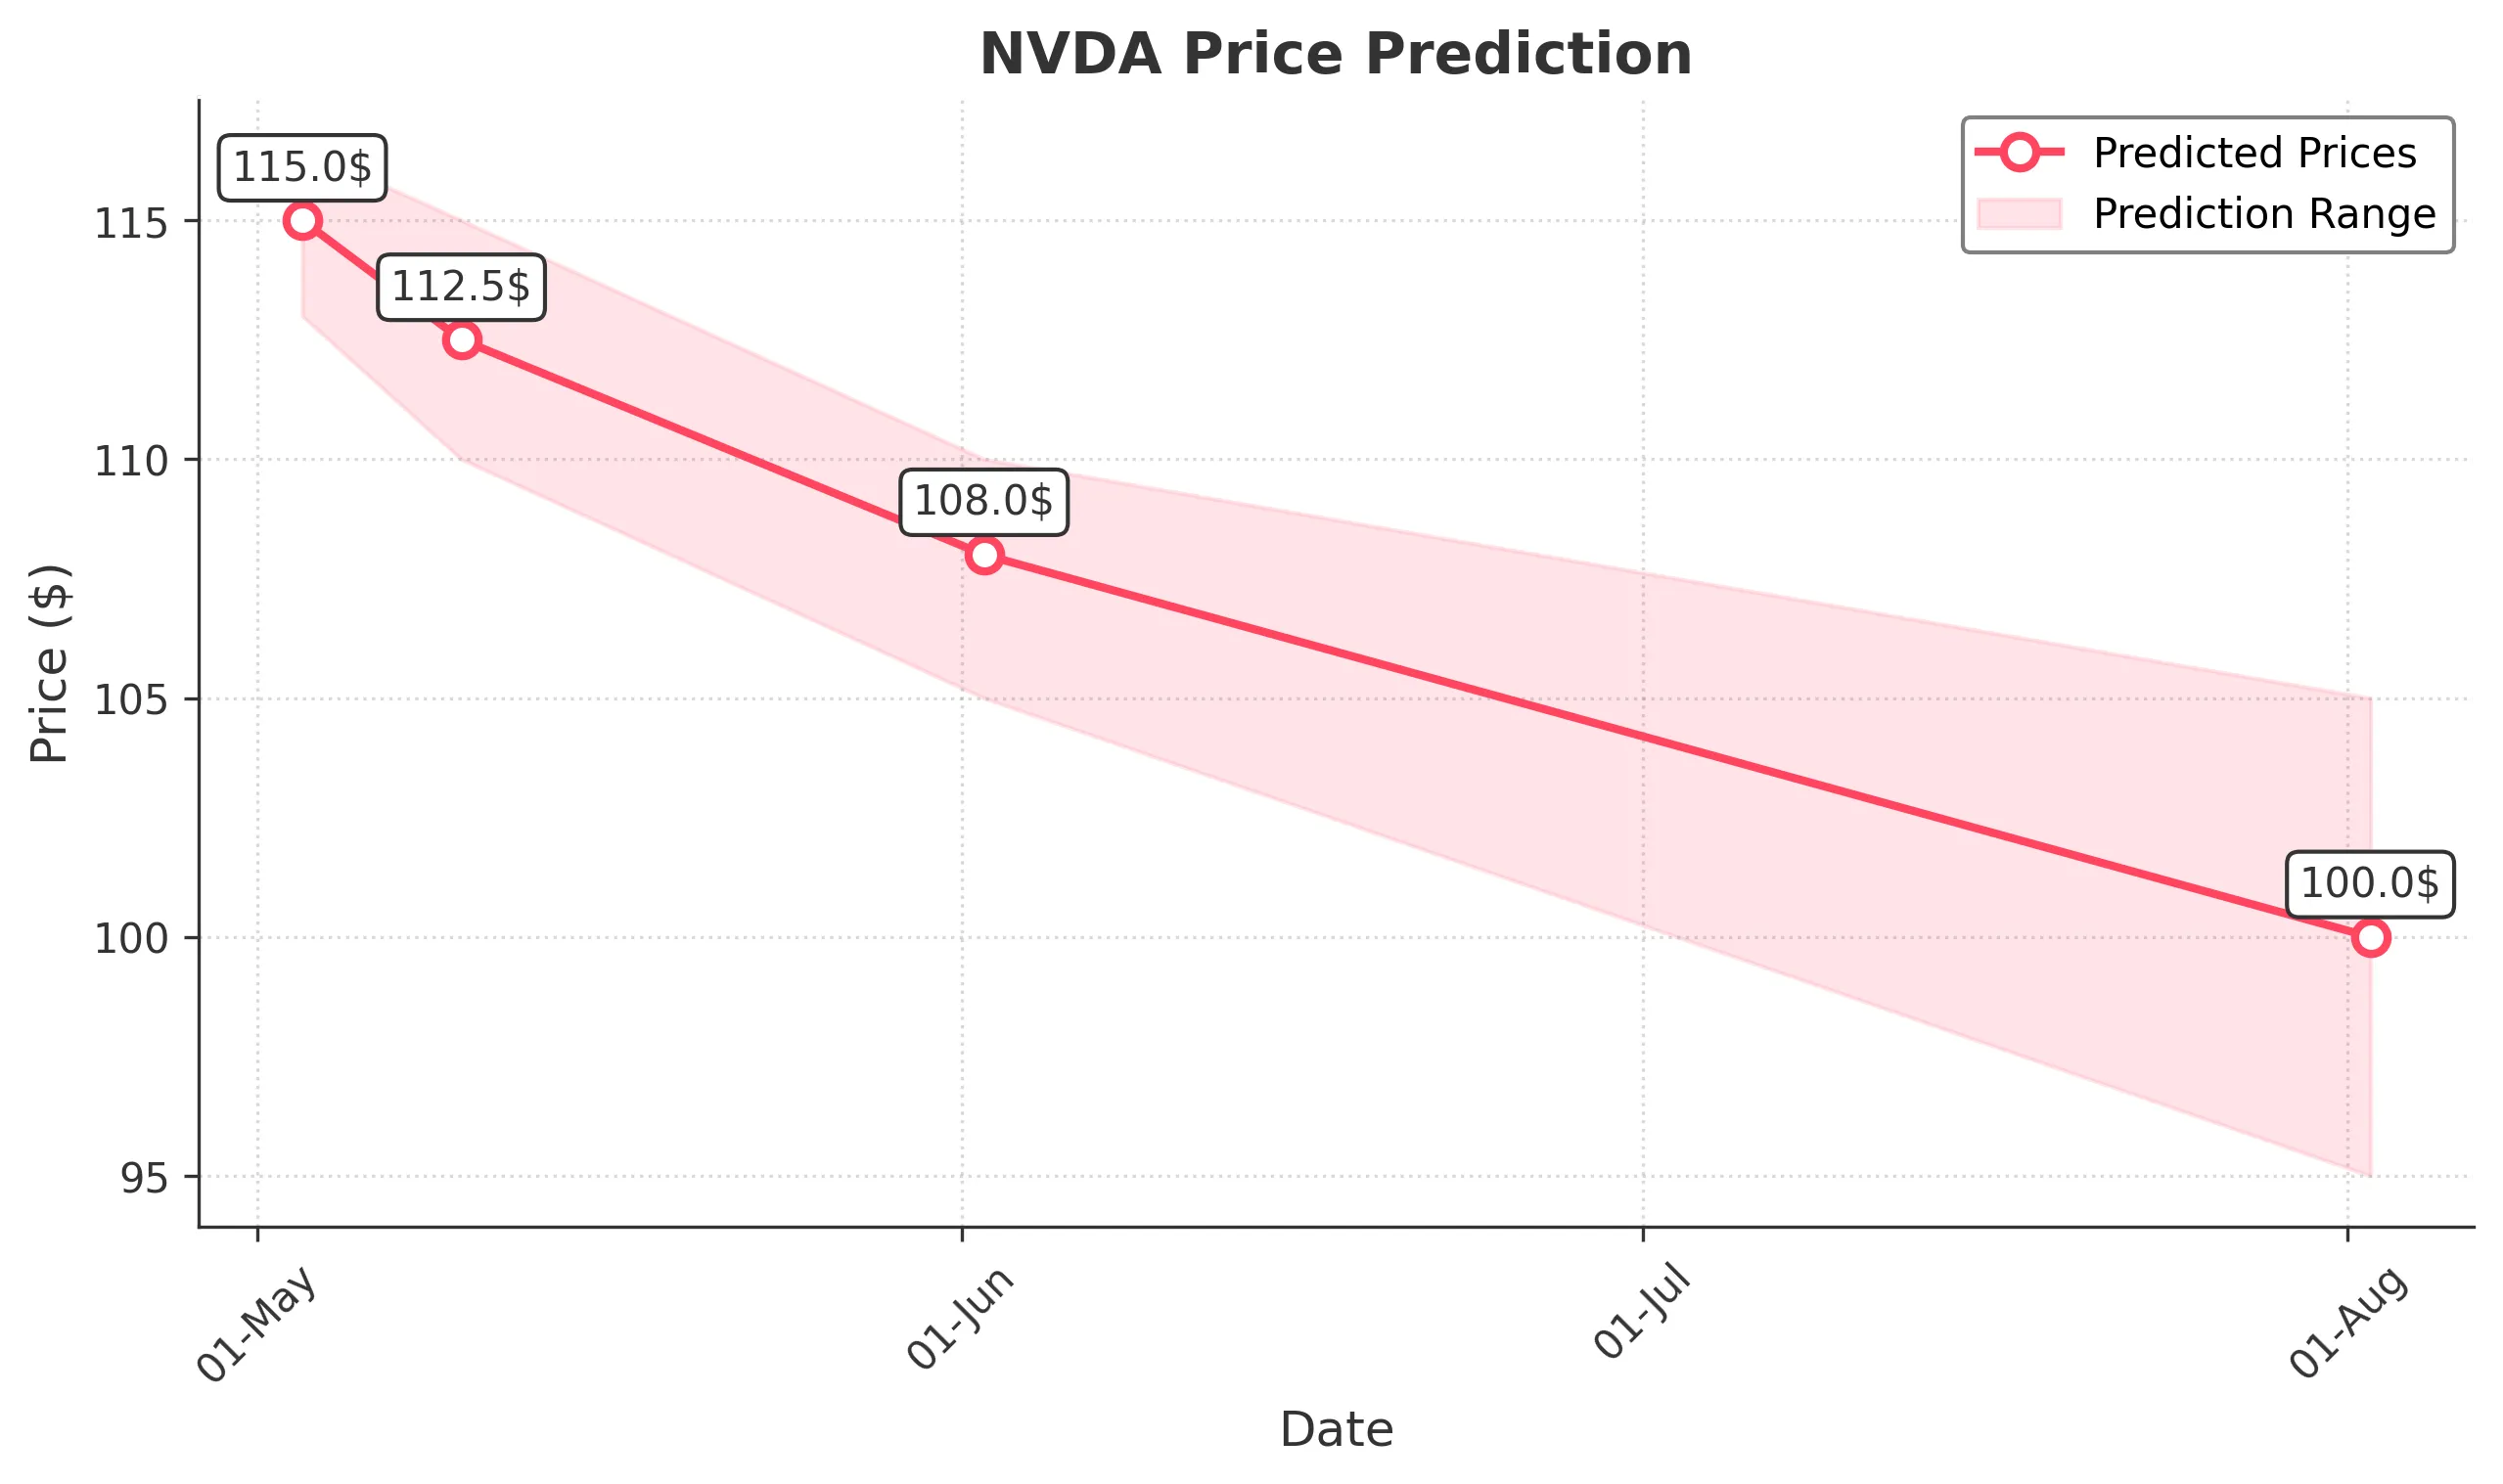
Target: May 3, 2025$115
$114.5
$116.5
$113
Description
The stock shows a slight bullish trend with a recent upward movement. RSI indicates overbought conditions, suggesting a potential pullback. However, strong support at $113 may hold. Volume is expected to be moderate as traders react to earnings news.
Analysis
Over the past 3 months, NVDA has shown volatility with a bearish trend recently. Key support at $113 and resistance at $120. Moving averages indicate a downward trend, while volume spikes suggest increased selling pressure. Market sentiment is cautious.
Confidence Level
Potential Risks
Potential for a reversal due to overbought RSI and market sentiment shifts.
1 Week Prediction
Target: May 10, 2025$112.5
$113
$115
$110
Description
Expect a slight decline as the stock faces resistance at $115. The MACD shows bearish divergence, indicating potential downward momentum. Volume may increase as traders react to broader market trends.
Analysis
The stock has been in a bearish phase, with significant resistance at $115. Recent candlestick patterns suggest indecision, and the ATR indicates increased volatility. Support at $110 is critical for maintaining upward momentum.
Confidence Level
Potential Risks
Market volatility and external economic factors could impact the prediction.
1 Month Prediction
Target: June 2, 2025$108
$109
$110
$105
Description
A bearish outlook is anticipated as the stock may test lower support levels. The recent downtrend and bearish candlestick patterns suggest continued selling pressure. Volume may remain elevated as traders react to earnings reports.
Analysis
NVDA has experienced a significant decline, with key support at $105. The RSI indicates oversold conditions, but bearish momentum persists. Volume analysis shows increased selling, and macroeconomic factors may weigh on performance.
Confidence Level
Potential Risks
Unexpected market news or earnings surprises could alter the trend.
3 Months Prediction
Target: August 2, 2025$100
$102
$105
$95
Description
Long-term bearish sentiment is expected as the stock may continue to decline. The overall market trend and economic conditions suggest further downside risk. Key support at $95 will be critical to watch.
Analysis
The stock has been in a bearish trend, with significant resistance at $105. The moving averages indicate a downward trajectory, and volume patterns suggest increased selling. Market sentiment remains cautious amid economic uncertainties.
Confidence Level
Potential Risks
Macroeconomic changes or positive earnings could lead to unexpected price movements.