NVDA Trading Predictions
1 Day Prediction
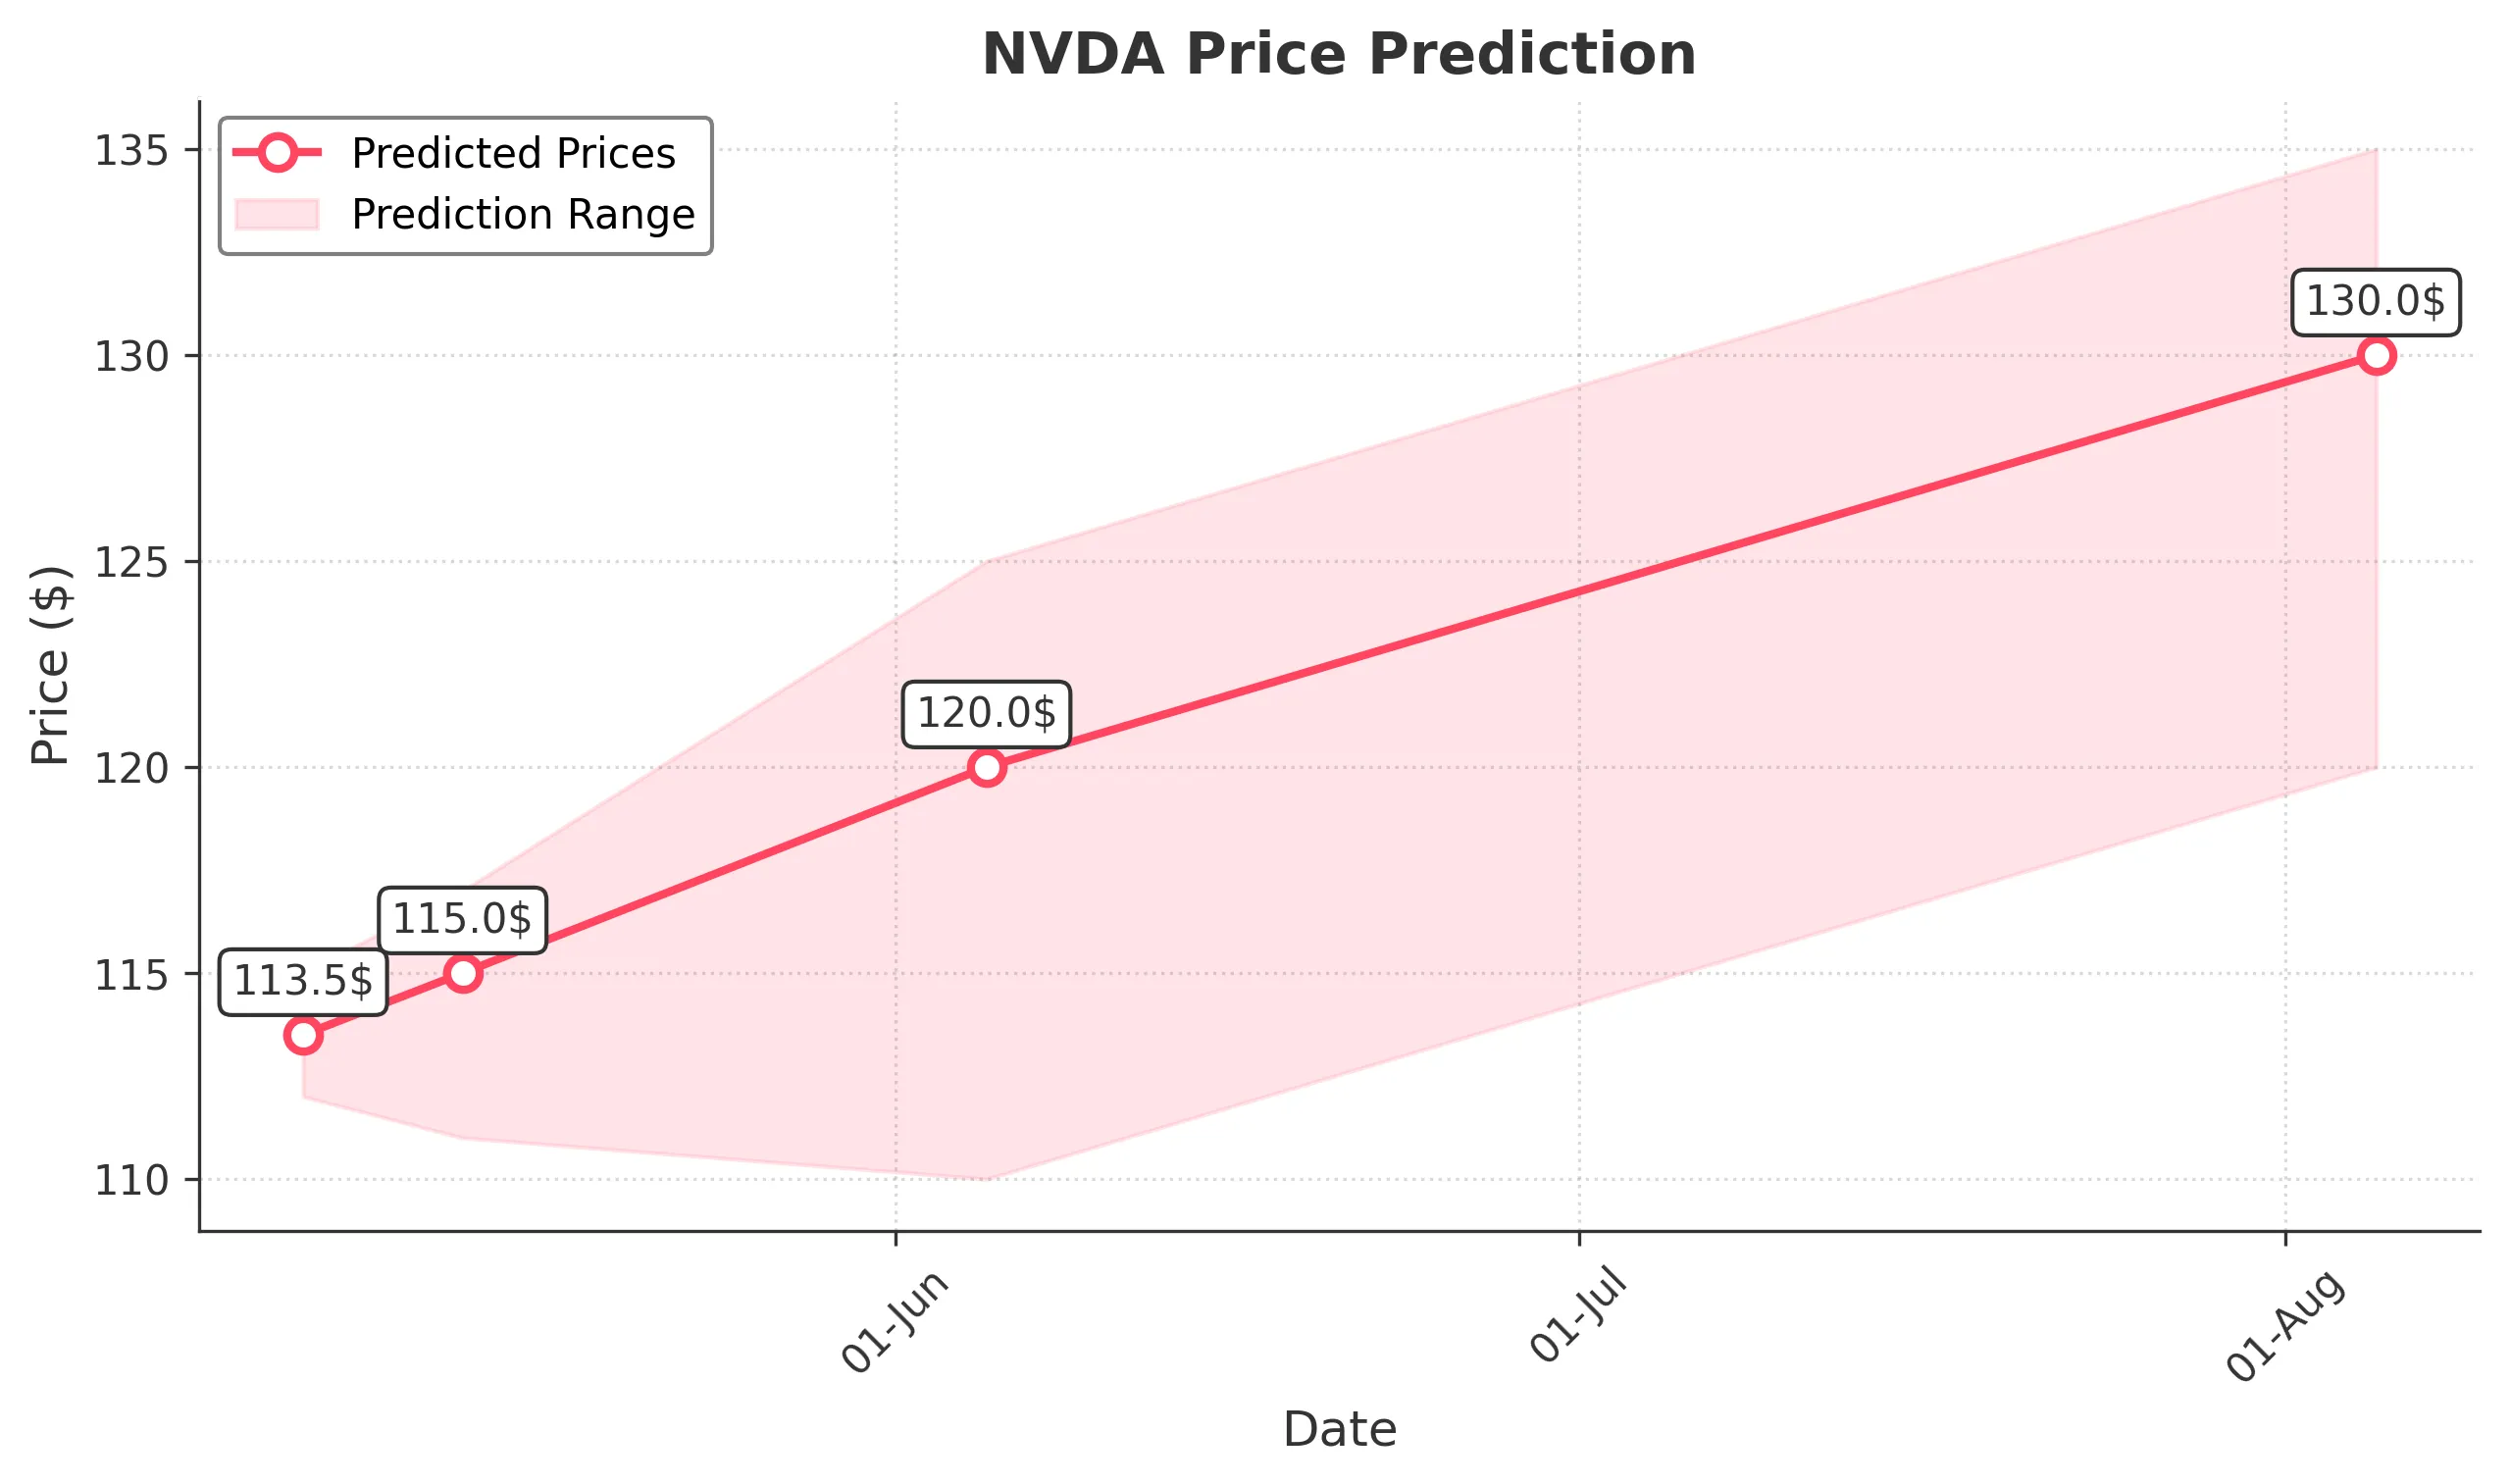
Target: May 6, 2025$113.5
$113
$115
$112
Description
The stock shows a slight bullish trend with a recent Doji pattern indicating indecision. RSI is neutral, and MACD is close to crossing above the signal line. Expect a minor rebound as market sentiment stabilizes.
Analysis
Over the past 3 months, NVDA has experienced significant volatility, with a bearish trend recently. Key support at $100 and resistance at $140. Volume spikes indicate strong interest, but recent declines raise concerns about further downward pressure.
Confidence Level
Potential Risks
Potential volatility due to macroeconomic news could impact the prediction.
1 Week Prediction
Target: May 13, 2025$115
$113.5
$117
$111
Description
A potential recovery is indicated as the stock approaches key Fibonacci retracement levels. The MACD shows bullish divergence, suggesting upward momentum. However, market sentiment remains cautious.
Analysis
The stock has been in a bearish phase, with significant resistance at $120. Recent candlestick patterns suggest a possible reversal, but overall market sentiment remains mixed, influenced by broader economic conditions.
Confidence Level
Potential Risks
Market reactions to earnings reports or economic data could lead to unexpected volatility.
1 Month Prediction
Target: June 5, 2025$120
$115
$125
$110
Description
Expect a gradual recovery as the stock approaches the 50-day moving average. The RSI is showing signs of improvement, and volume trends suggest increasing interest. However, macroeconomic factors could still weigh heavily.
Analysis
The stock has shown a bearish trend with recent lows around $100. Key resistance at $125 and support at $110. Technical indicators suggest potential for recovery, but external factors may hinder progress.
Confidence Level
Potential Risks
Economic indicators and earnings reports could lead to significant fluctuations.
3 Months Prediction
Target: August 5, 2025$130
$125
$135
$120
Description
Long-term outlook appears bullish as the stock may break through resistance levels. Positive earnings and market sentiment could drive prices higher, but caution is advised due to potential market corrections.
Analysis
The stock has been volatile, with a bearish trend recently. Key support at $100 and resistance at $140. Technical indicators suggest potential for recovery, but external economic factors could pose risks.
Confidence Level
Potential Risks
Unforeseen market events or economic downturns could impact the stock's performance.