NVDA Trading Predictions
1 Day Prediction
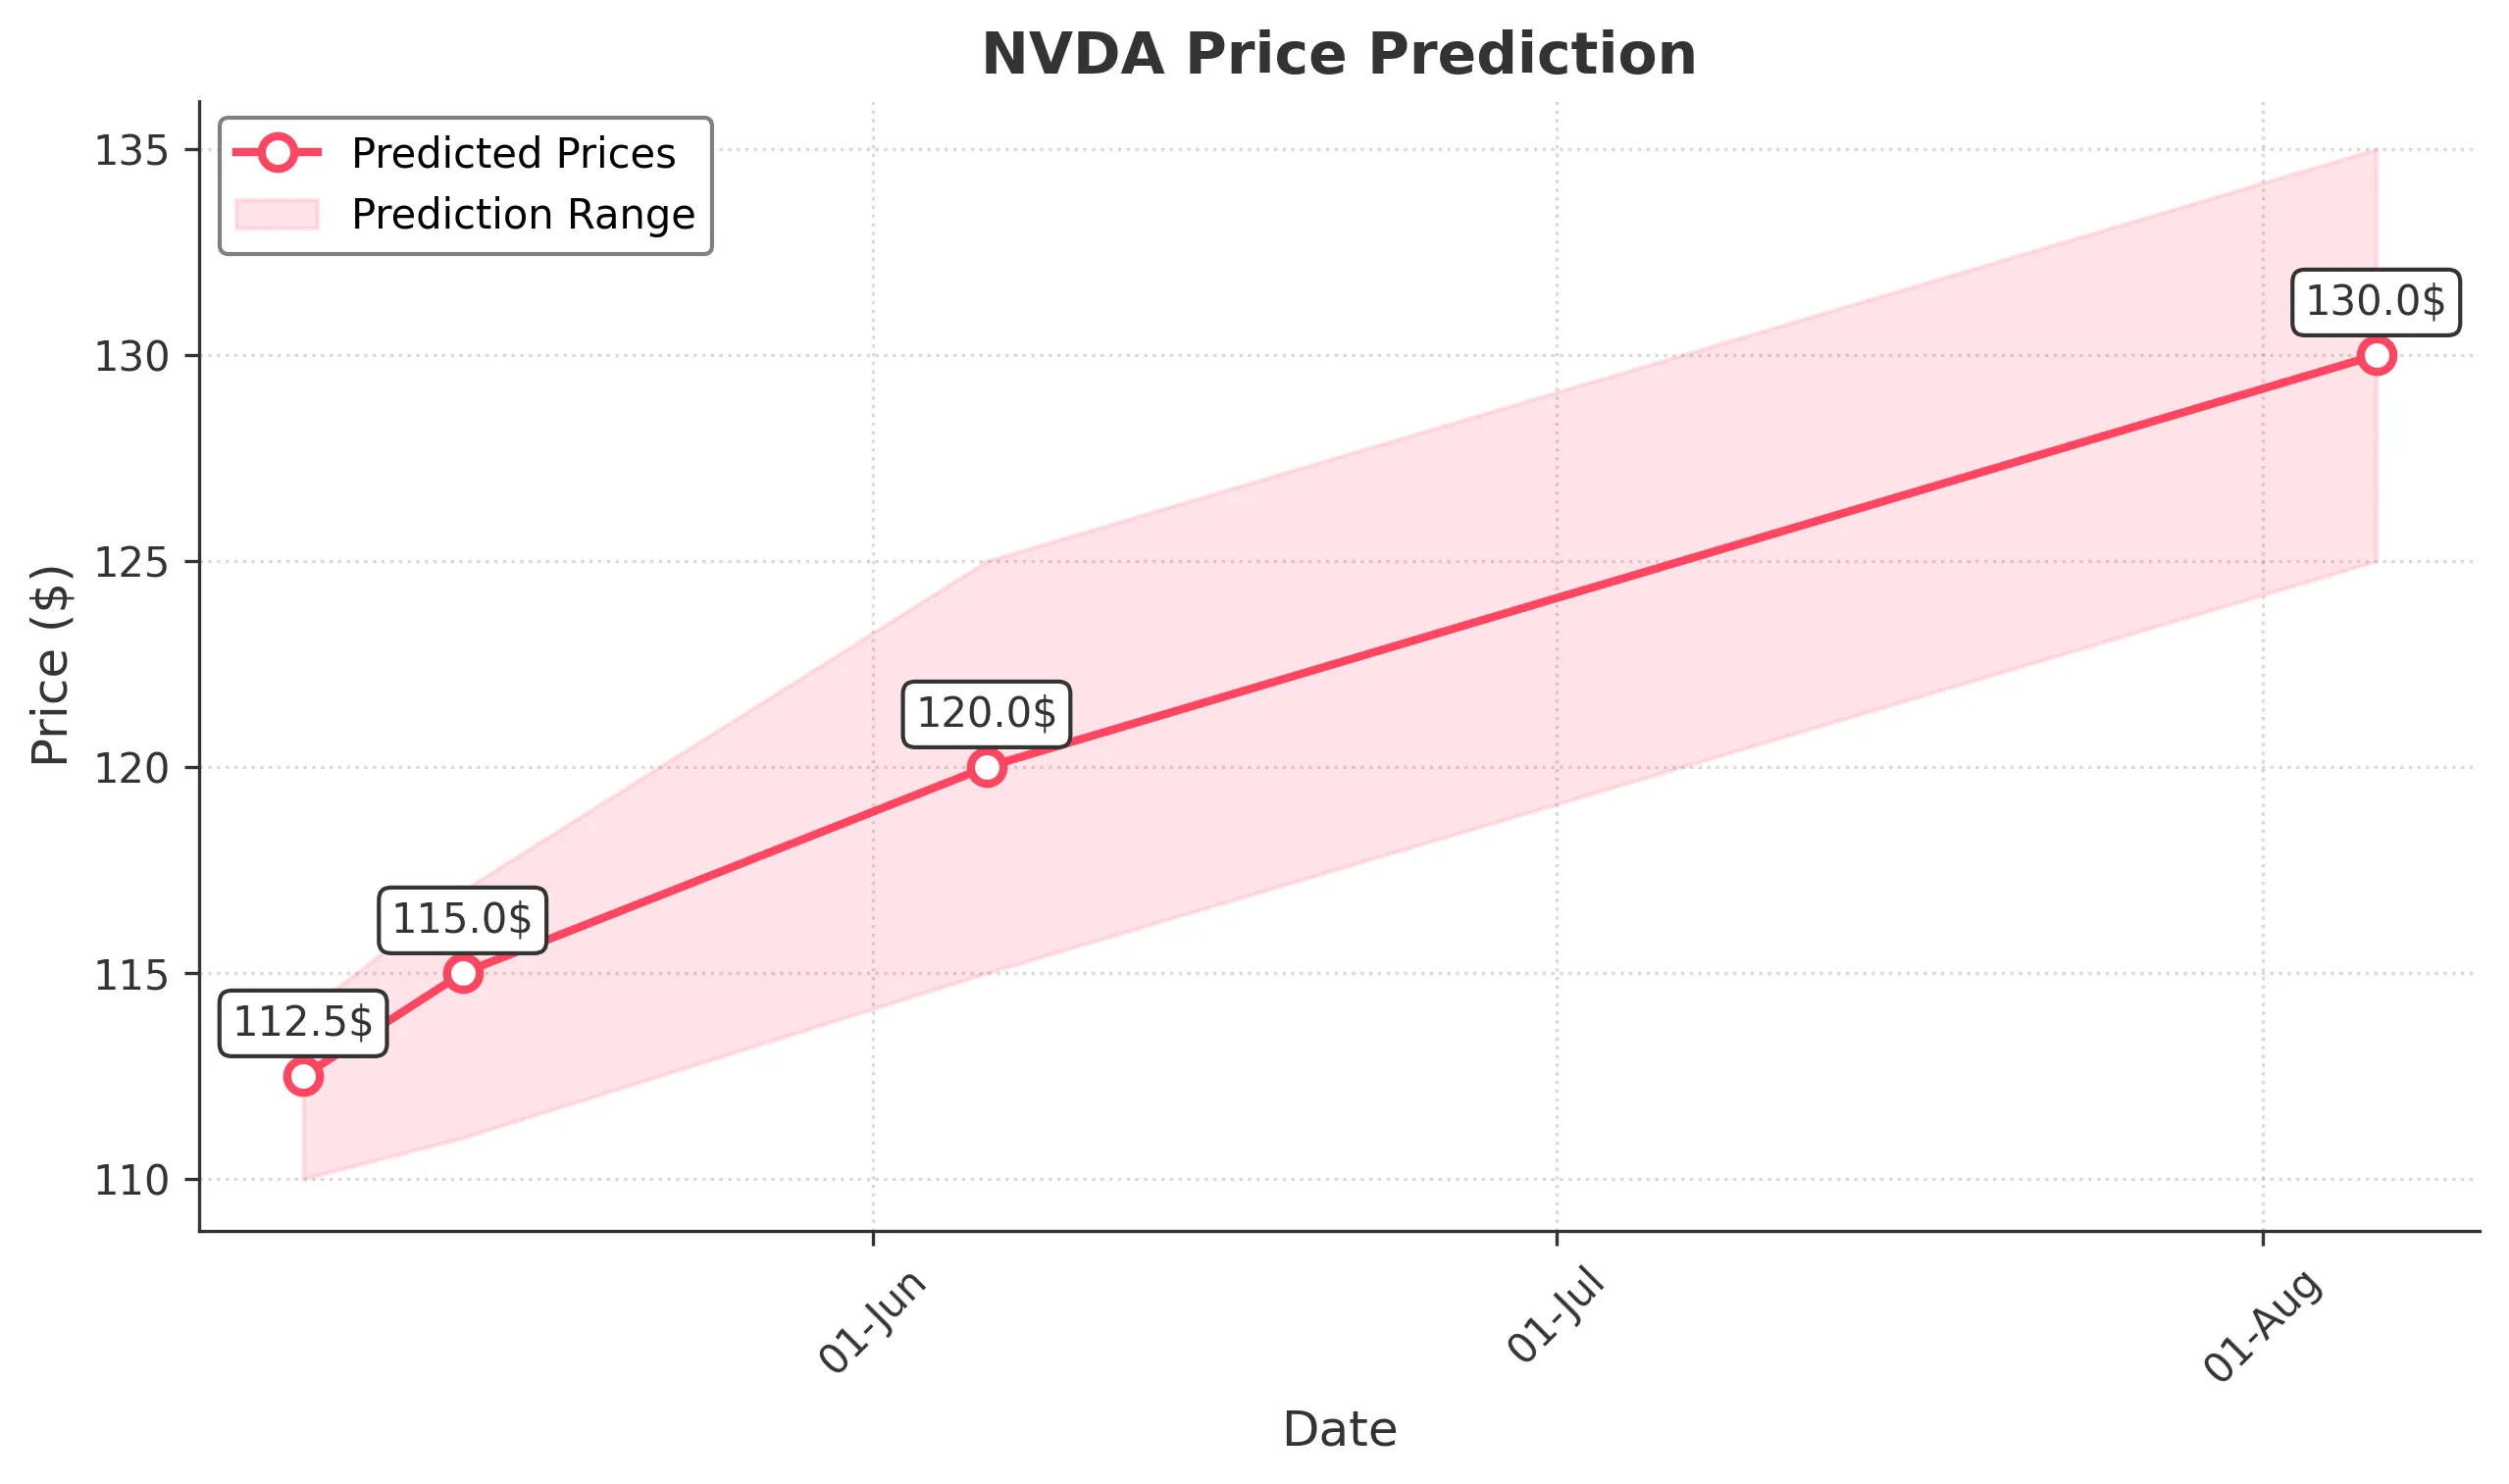
Target: May 7, 2025$112.5
$111.5
$114
$110
Description
The stock shows a slight bullish trend with a potential close around 112.50. The RSI is neutral, and MACD indicates a potential upward momentum. However, recent volatility suggests caution.
Analysis
Over the past 3 months, NVDA has experienced significant volatility, with a bearish trend recently. Key support at 110.00 and resistance at 115.00. Volume spikes indicate investor uncertainty. Technical indicators show mixed signals.
Confidence Level
Potential Risks
Market sentiment could shift due to external news or earnings reports, impacting the prediction.
1 Week Prediction
Target: May 14, 2025$115
$113.5
$117
$111
Description
A potential recovery is indicated with a close around 115.00. The MACD shows bullish divergence, and the RSI is approaching oversold levels, suggesting a rebound may occur.
Analysis
The stock has shown a bearish trend recently, with significant support at 110.00. The MACD indicates potential bullish momentum, but the overall market sentiment remains cautious.
Confidence Level
Potential Risks
Market volatility and external economic factors could lead to unexpected price movements.
1 Month Prediction
Target: June 6, 2025$120
$118
$125
$115
Description
Expect a gradual recovery towards 120.00 as market sentiment improves. The Bollinger Bands suggest potential upward movement, but caution is advised due to recent volatility.
Analysis
The stock has been in a bearish phase, with key resistance at 125.00. Technical indicators show potential for recovery, but overall market conditions remain uncertain.
Confidence Level
Potential Risks
Unforeseen macroeconomic events could impact the stock's recovery trajectory.
3 Months Prediction
Target: August 6, 2025$130
$128
$135
$125
Description
A potential bullish trend could lead to a close around 130.00. The Fibonacci retracement levels suggest a recovery, but external factors may influence this trajectory.
Analysis
The stock has shown significant fluctuations, with a bearish trend recently. Key resistance at 135.00 and support at 125.00. Technical indicators suggest potential for recovery, but market sentiment remains mixed.
Confidence Level
Potential Risks
Long-term predictions are uncertain due to market volatility and potential economic shifts.