NVDA Trading Predictions
1 Day Prediction
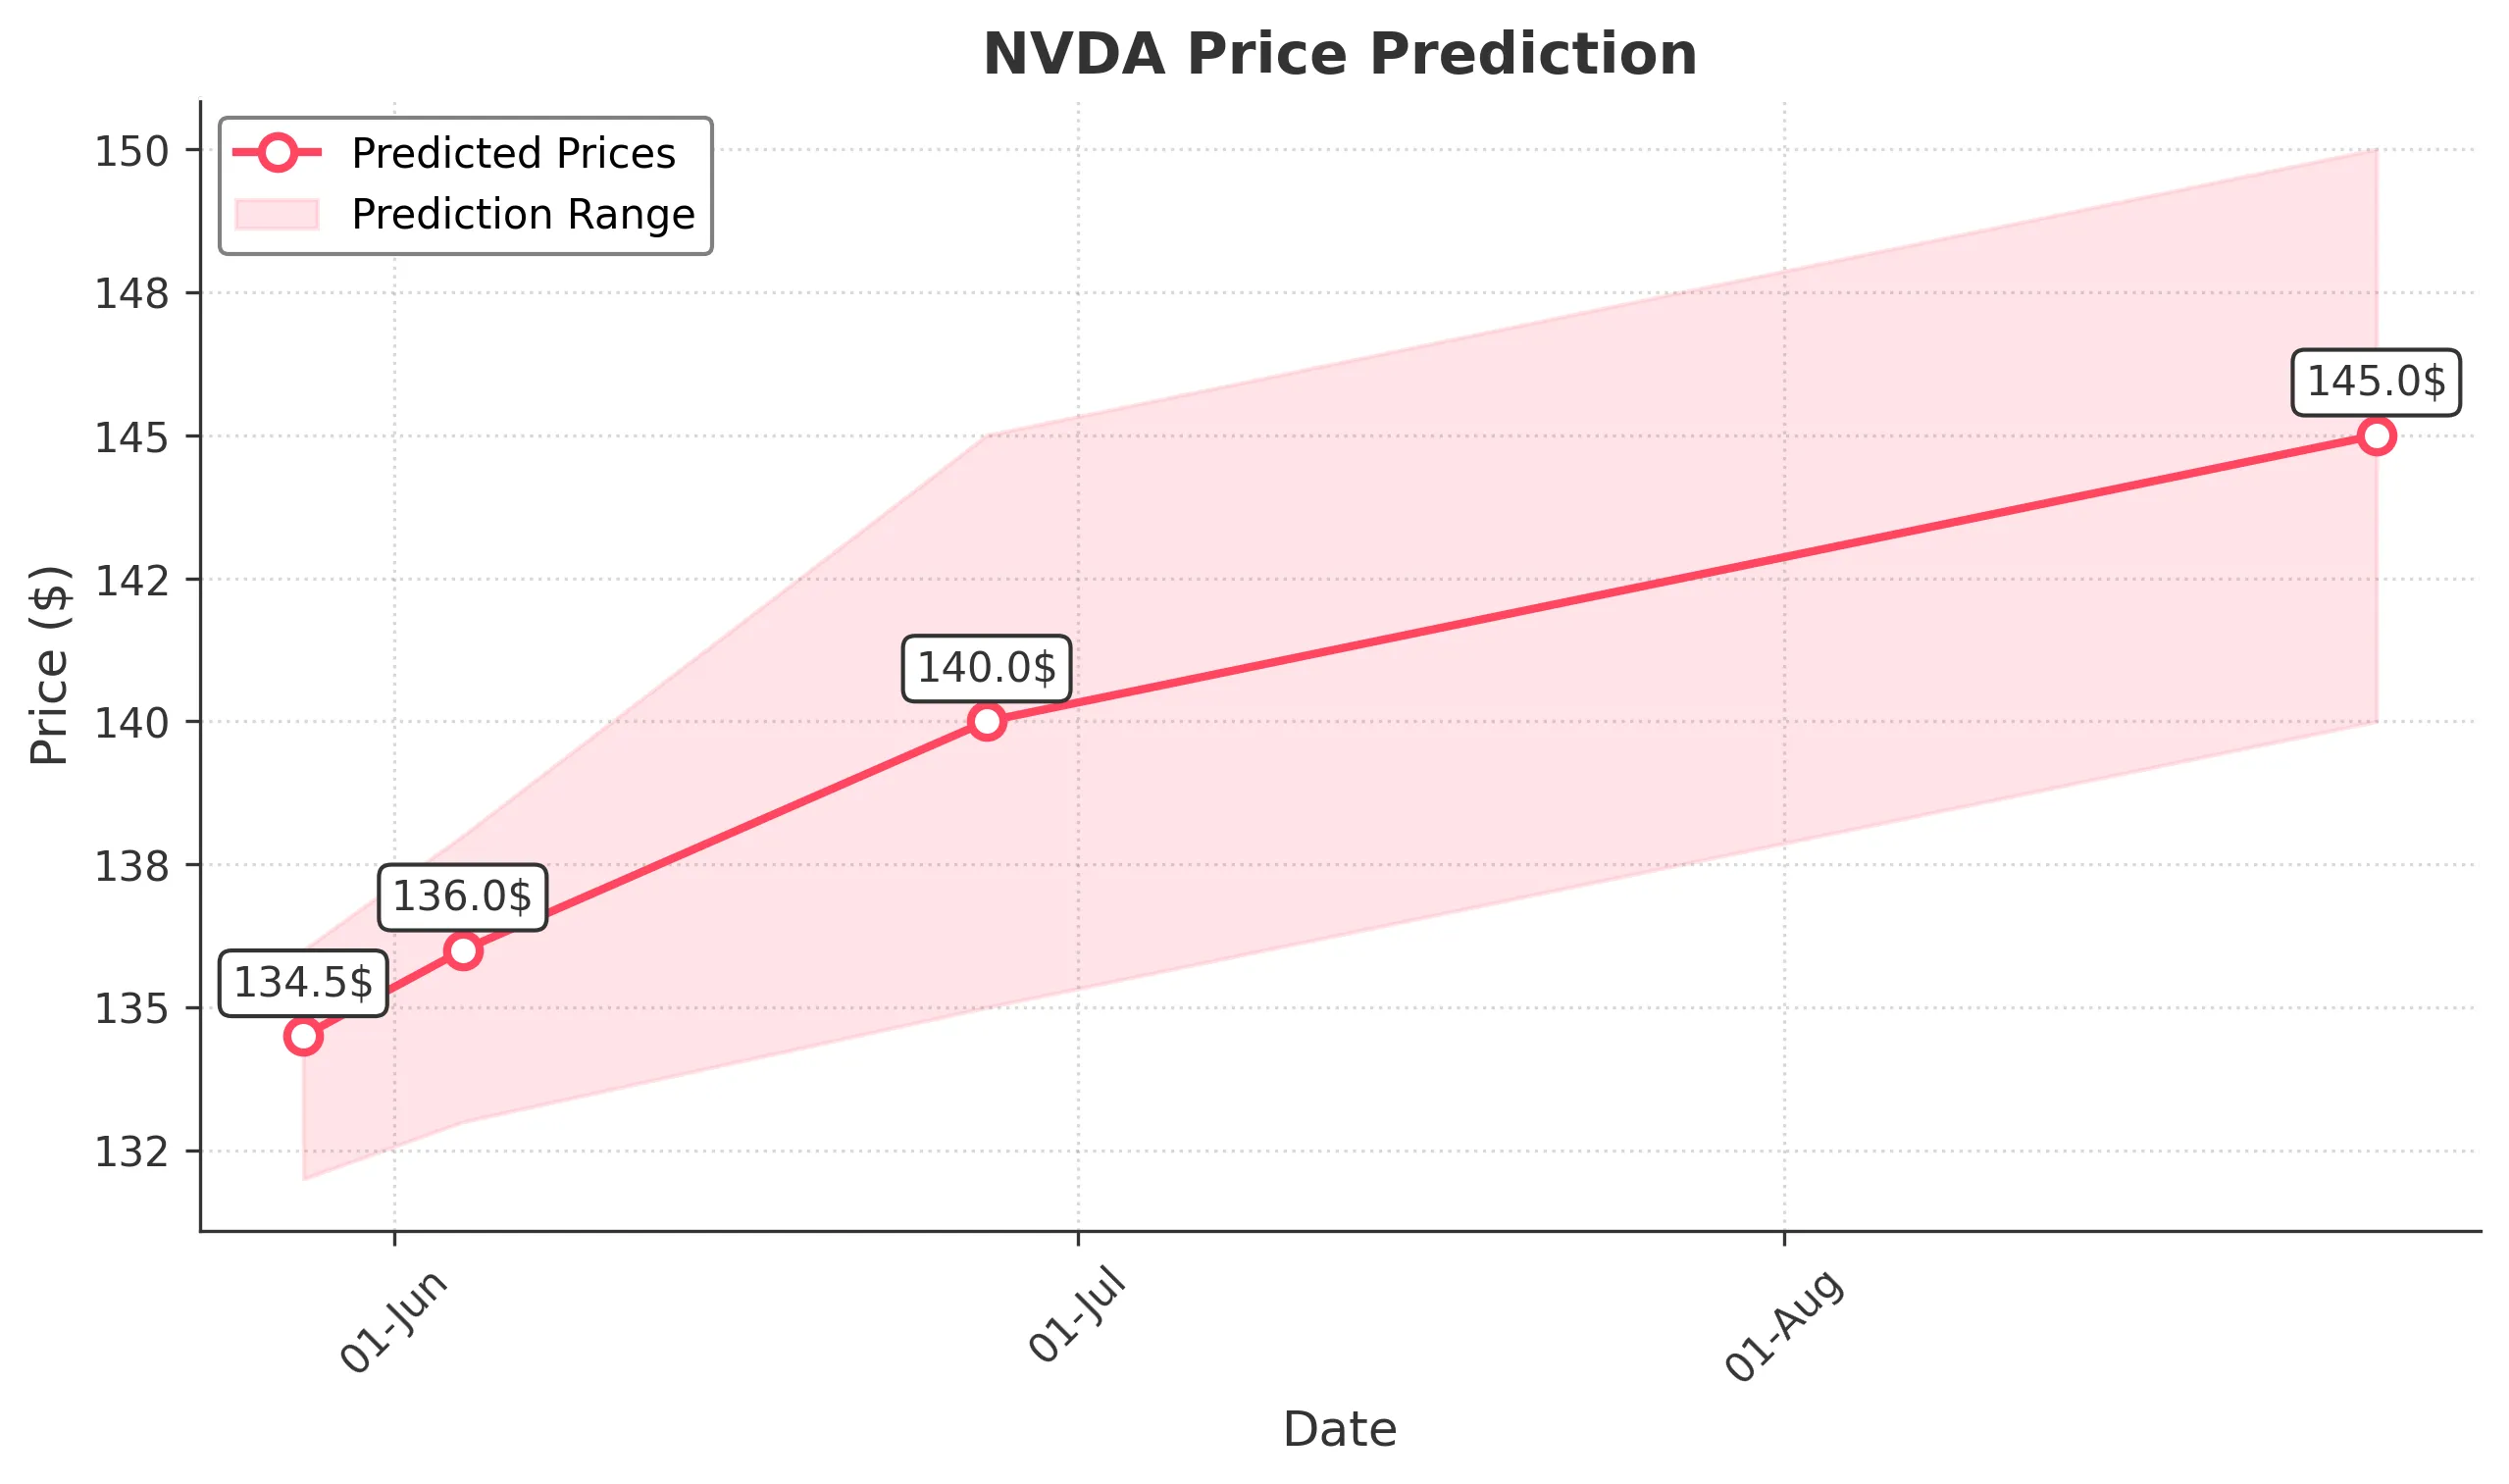
Target: May 28, 2025$134.5
$134
$136
$132
Description
The stock shows bullish momentum with a recent upward trend. The RSI is approaching overbought levels, indicating potential for a pullback. However, the MACD is positive, suggesting continued upward movement. Volume remains stable, supporting the bullish outlook.
Analysis
Over the past 3 months, NVDA has shown a bullish trend, recovering from lows around $94. The recent price action indicates strong support around $130, with resistance near $136. Technical indicators like the MACD and moving averages support further gains, but RSI suggests caution.
Confidence Level
Potential Risks
Potential market volatility and profit-taking could lead to a short-term pullback.
1 Week Prediction
Target: June 4, 2025$136
$135.5
$138
$133
Description
The stock is expected to continue its upward trajectory, supported by strong buying interest. The Bollinger Bands indicate potential for a breakout. However, the RSI nearing overbought levels suggests caution for short-term traders.
Analysis
NVDA has been on a bullish run, with significant support at $130. The recent price action shows a strong recovery from recent lows, and technical indicators suggest further upside potential. However, external factors could introduce volatility.
Confidence Level
Potential Risks
Market sentiment could shift due to macroeconomic factors or earnings reports, impacting price.
1 Month Prediction
Target: June 27, 2025$140
$138
$145
$135
Description
The stock is likely to reach new highs as bullish sentiment persists. The Fibonacci retracement levels indicate a target around $140. However, the RSI suggests potential overbought conditions, which could lead to corrections.
Analysis
In the last three months, NVDA has shown a strong recovery from lows, with key support at $130. The stock's upward momentum is supported by positive technical indicators, but caution is warranted as the RSI approaches overbought territory.
Confidence Level
Potential Risks
Market corrections or negative news could impact the bullish trend, leading to price declines.
3 Months Prediction
Target: August 27, 2025$145
$143
$150
$140
Description
The stock is expected to continue its upward trend, potentially reaching $145. The MACD remains bullish, and the overall market sentiment is positive. However, external economic factors could introduce volatility.
Analysis
NVDA has demonstrated a strong bullish trend over the past three months, recovering from significant lows. Key support levels are established, but the potential for market volatility remains. Technical indicators suggest continued upward momentum, but caution is advised.
Confidence Level
Potential Risks
Unforeseen macroeconomic events or earnings reports could lead to significant price fluctuations.