NVDA Trading Predictions
1 Day Prediction
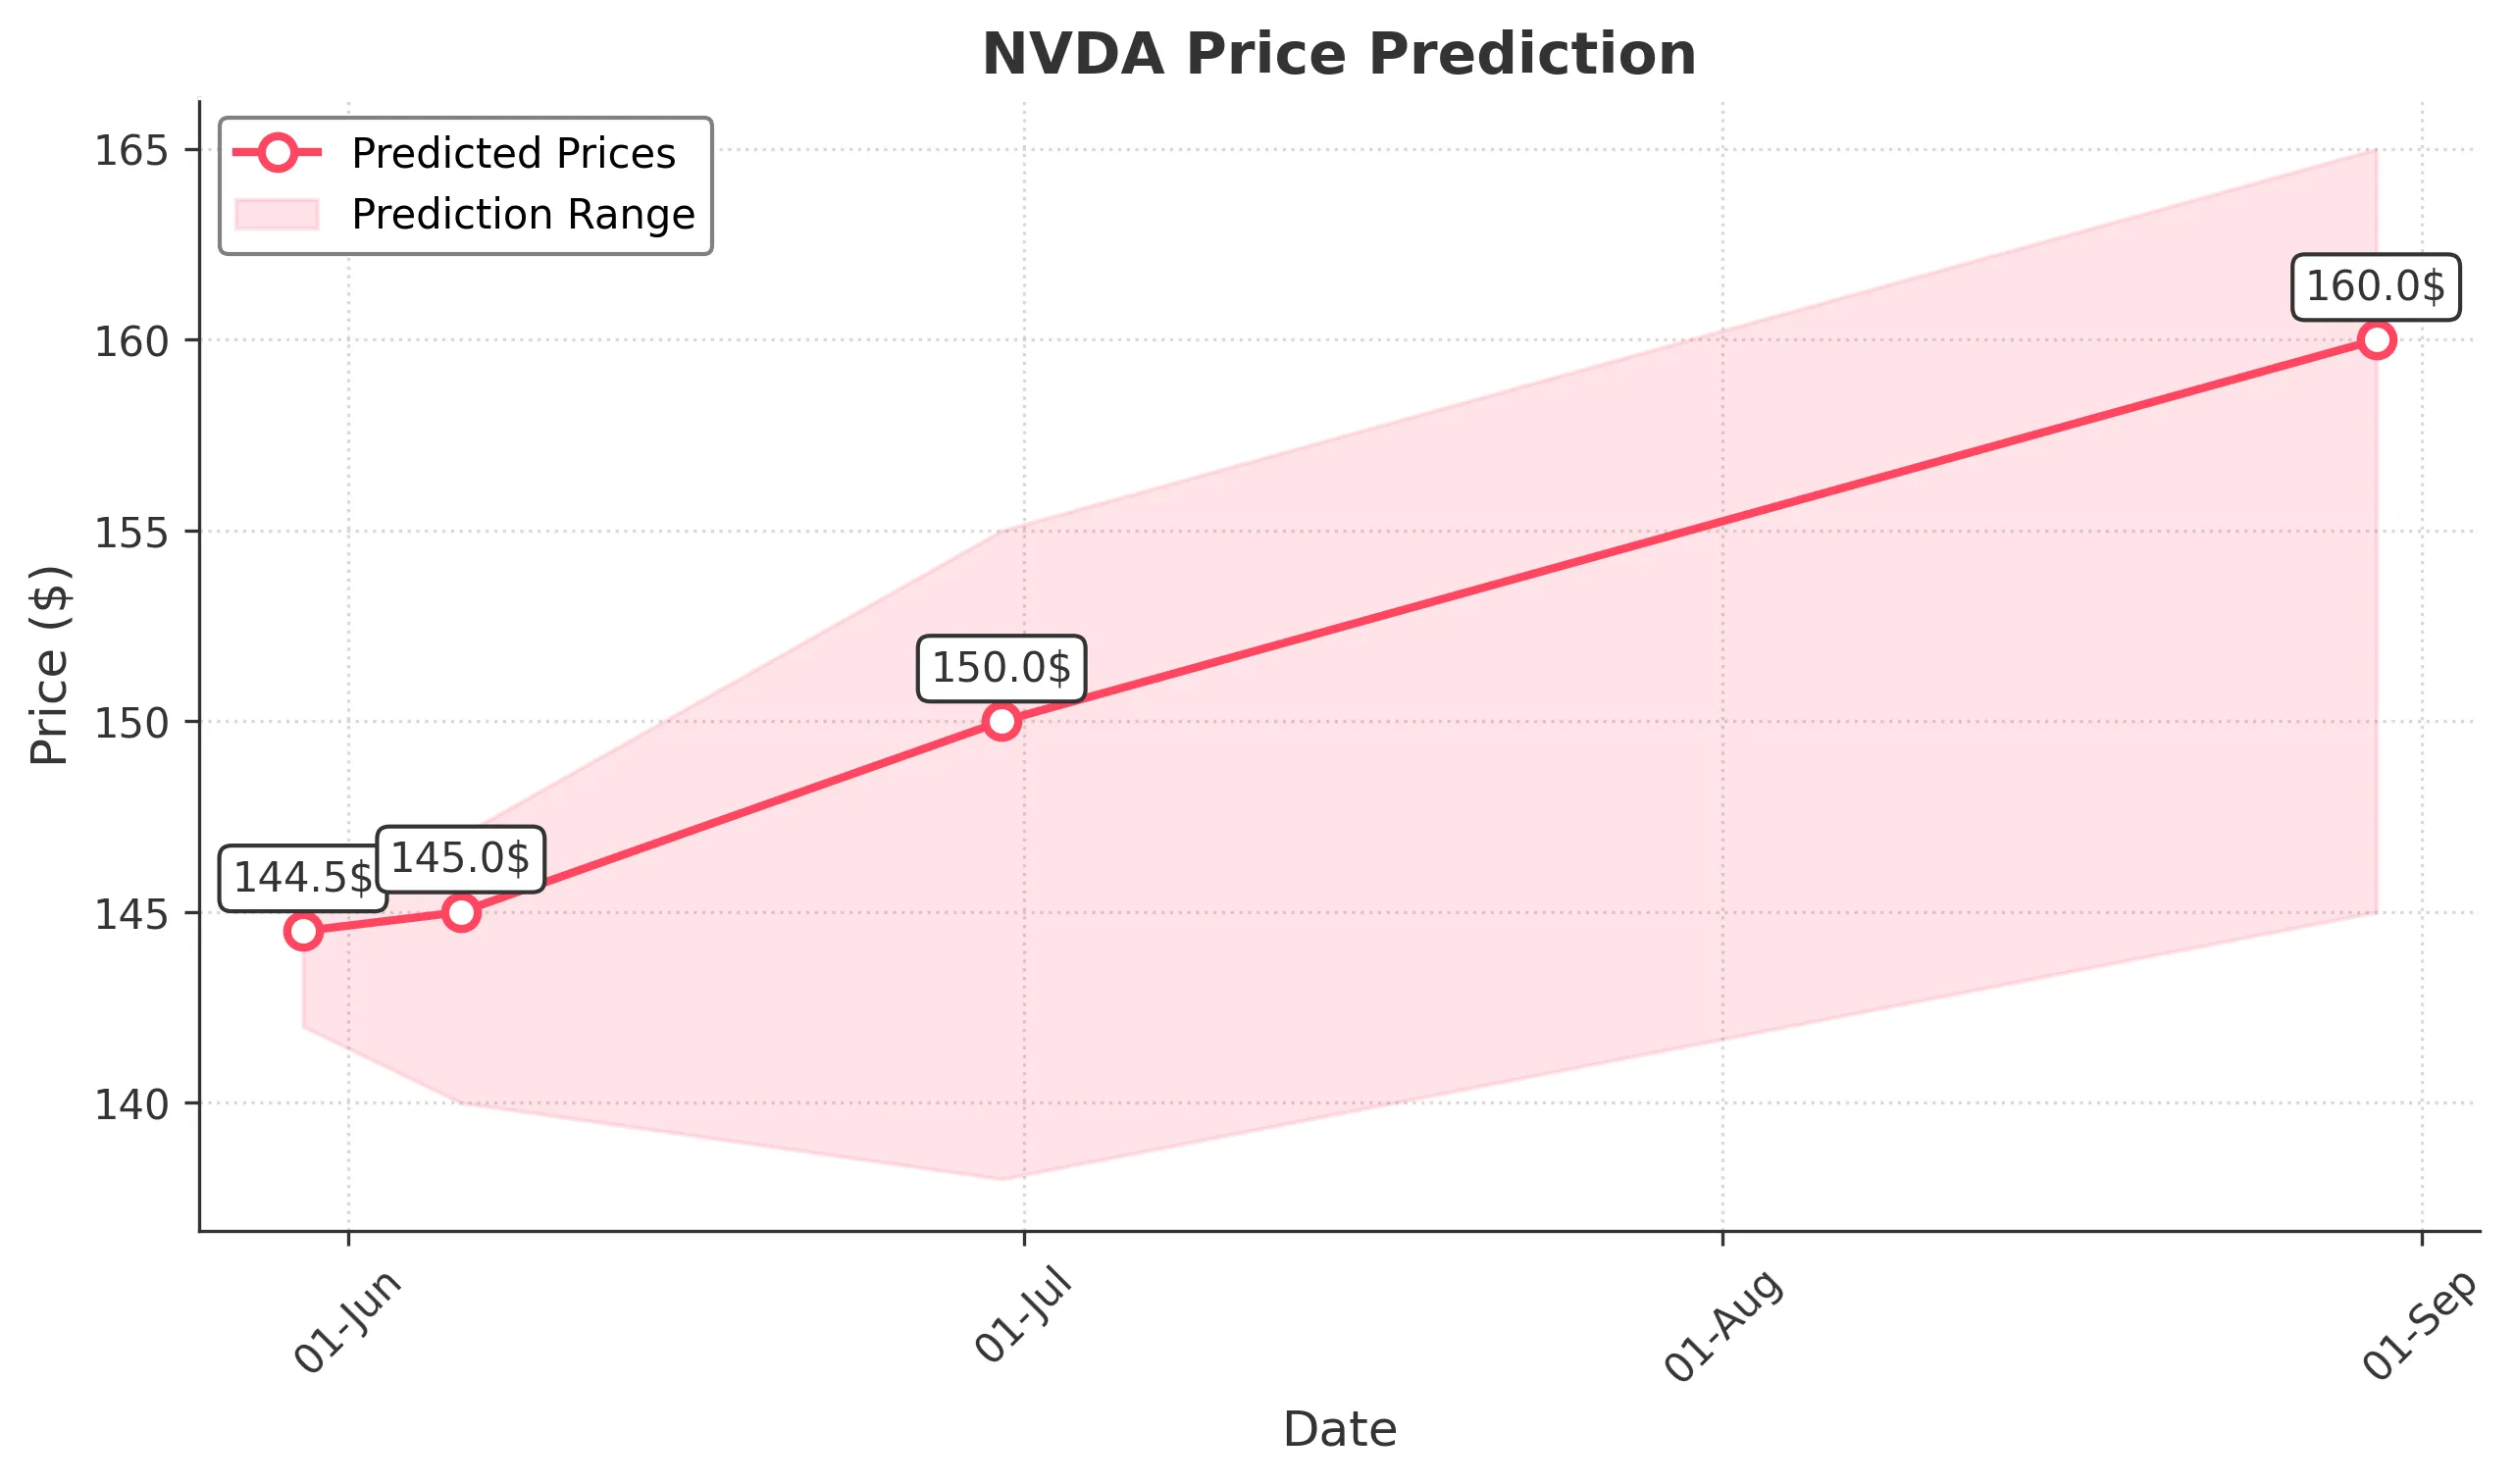
Target: May 30, 2025$144.5
$143
$145.5
$142
Description
The stock shows bullish momentum with a recent close above the 20-day moving average. RSI indicates overbought conditions, suggesting a potential pullback. However, strong volume and positive market sentiment may drive prices higher.
Analysis
Over the past 3 months, NVDA has shown a bullish trend, recovering from lows around $94. The recent price action indicates strong support at $130 and resistance near $145. Volume spikes on upward moves suggest strong buying interest.
Confidence Level
Potential Risks
Potential profit-taking could lead to volatility. Watch for any bearish reversal patterns.
1 Week Prediction
Target: June 6, 2025$145
$144
$147
$140
Description
The stock is expected to maintain its upward trajectory, supported by bullish candlestick patterns and a favorable MACD crossover. However, the RSI nearing overbought levels may indicate a correction is possible.
Analysis
NVDA has been on a bullish run, with significant support at $130. The recent price action shows a strong recovery from previous lows, with the MACD indicating upward momentum. However, the RSI suggests caution as it approaches overbought territory.
Confidence Level
Potential Risks
Market volatility and external economic factors could impact performance. Watch for any negative news.
1 Month Prediction
Target: June 30, 2025$150
$145
$155
$138
Description
With continued bullish sentiment and strong earnings reports expected, NVDA may reach new highs. Fibonacci retracement levels suggest $150 as a target, but overbought conditions could lead to a pullback.
Analysis
The stock has shown resilience, bouncing back from lows and establishing a bullish trend. Key resistance levels are around $150, while support remains strong at $130. The market sentiment is positive, but caution is warranted due to potential overbought conditions.
Confidence Level
Potential Risks
Earnings surprises or macroeconomic shifts could lead to volatility. Watch for signs of reversal.
3 Months Prediction
Target: August 30, 2025$160
$155
$165
$145
Description
If the bullish trend continues, NVDA could reach $160, driven by strong demand and positive market conditions. However, potential economic downturns or tech sector corrections could pose risks.
Analysis
The stock has shown a strong recovery and bullish trend over the past three months. Key support is at $130, while resistance is at $160. The market sentiment remains optimistic, but external factors could introduce volatility.
Confidence Level
Potential Risks
Economic uncertainties and sector volatility could impact the stock's performance. Monitor for any bearish signals.