NVDA Trading Predictions
1 Day Prediction
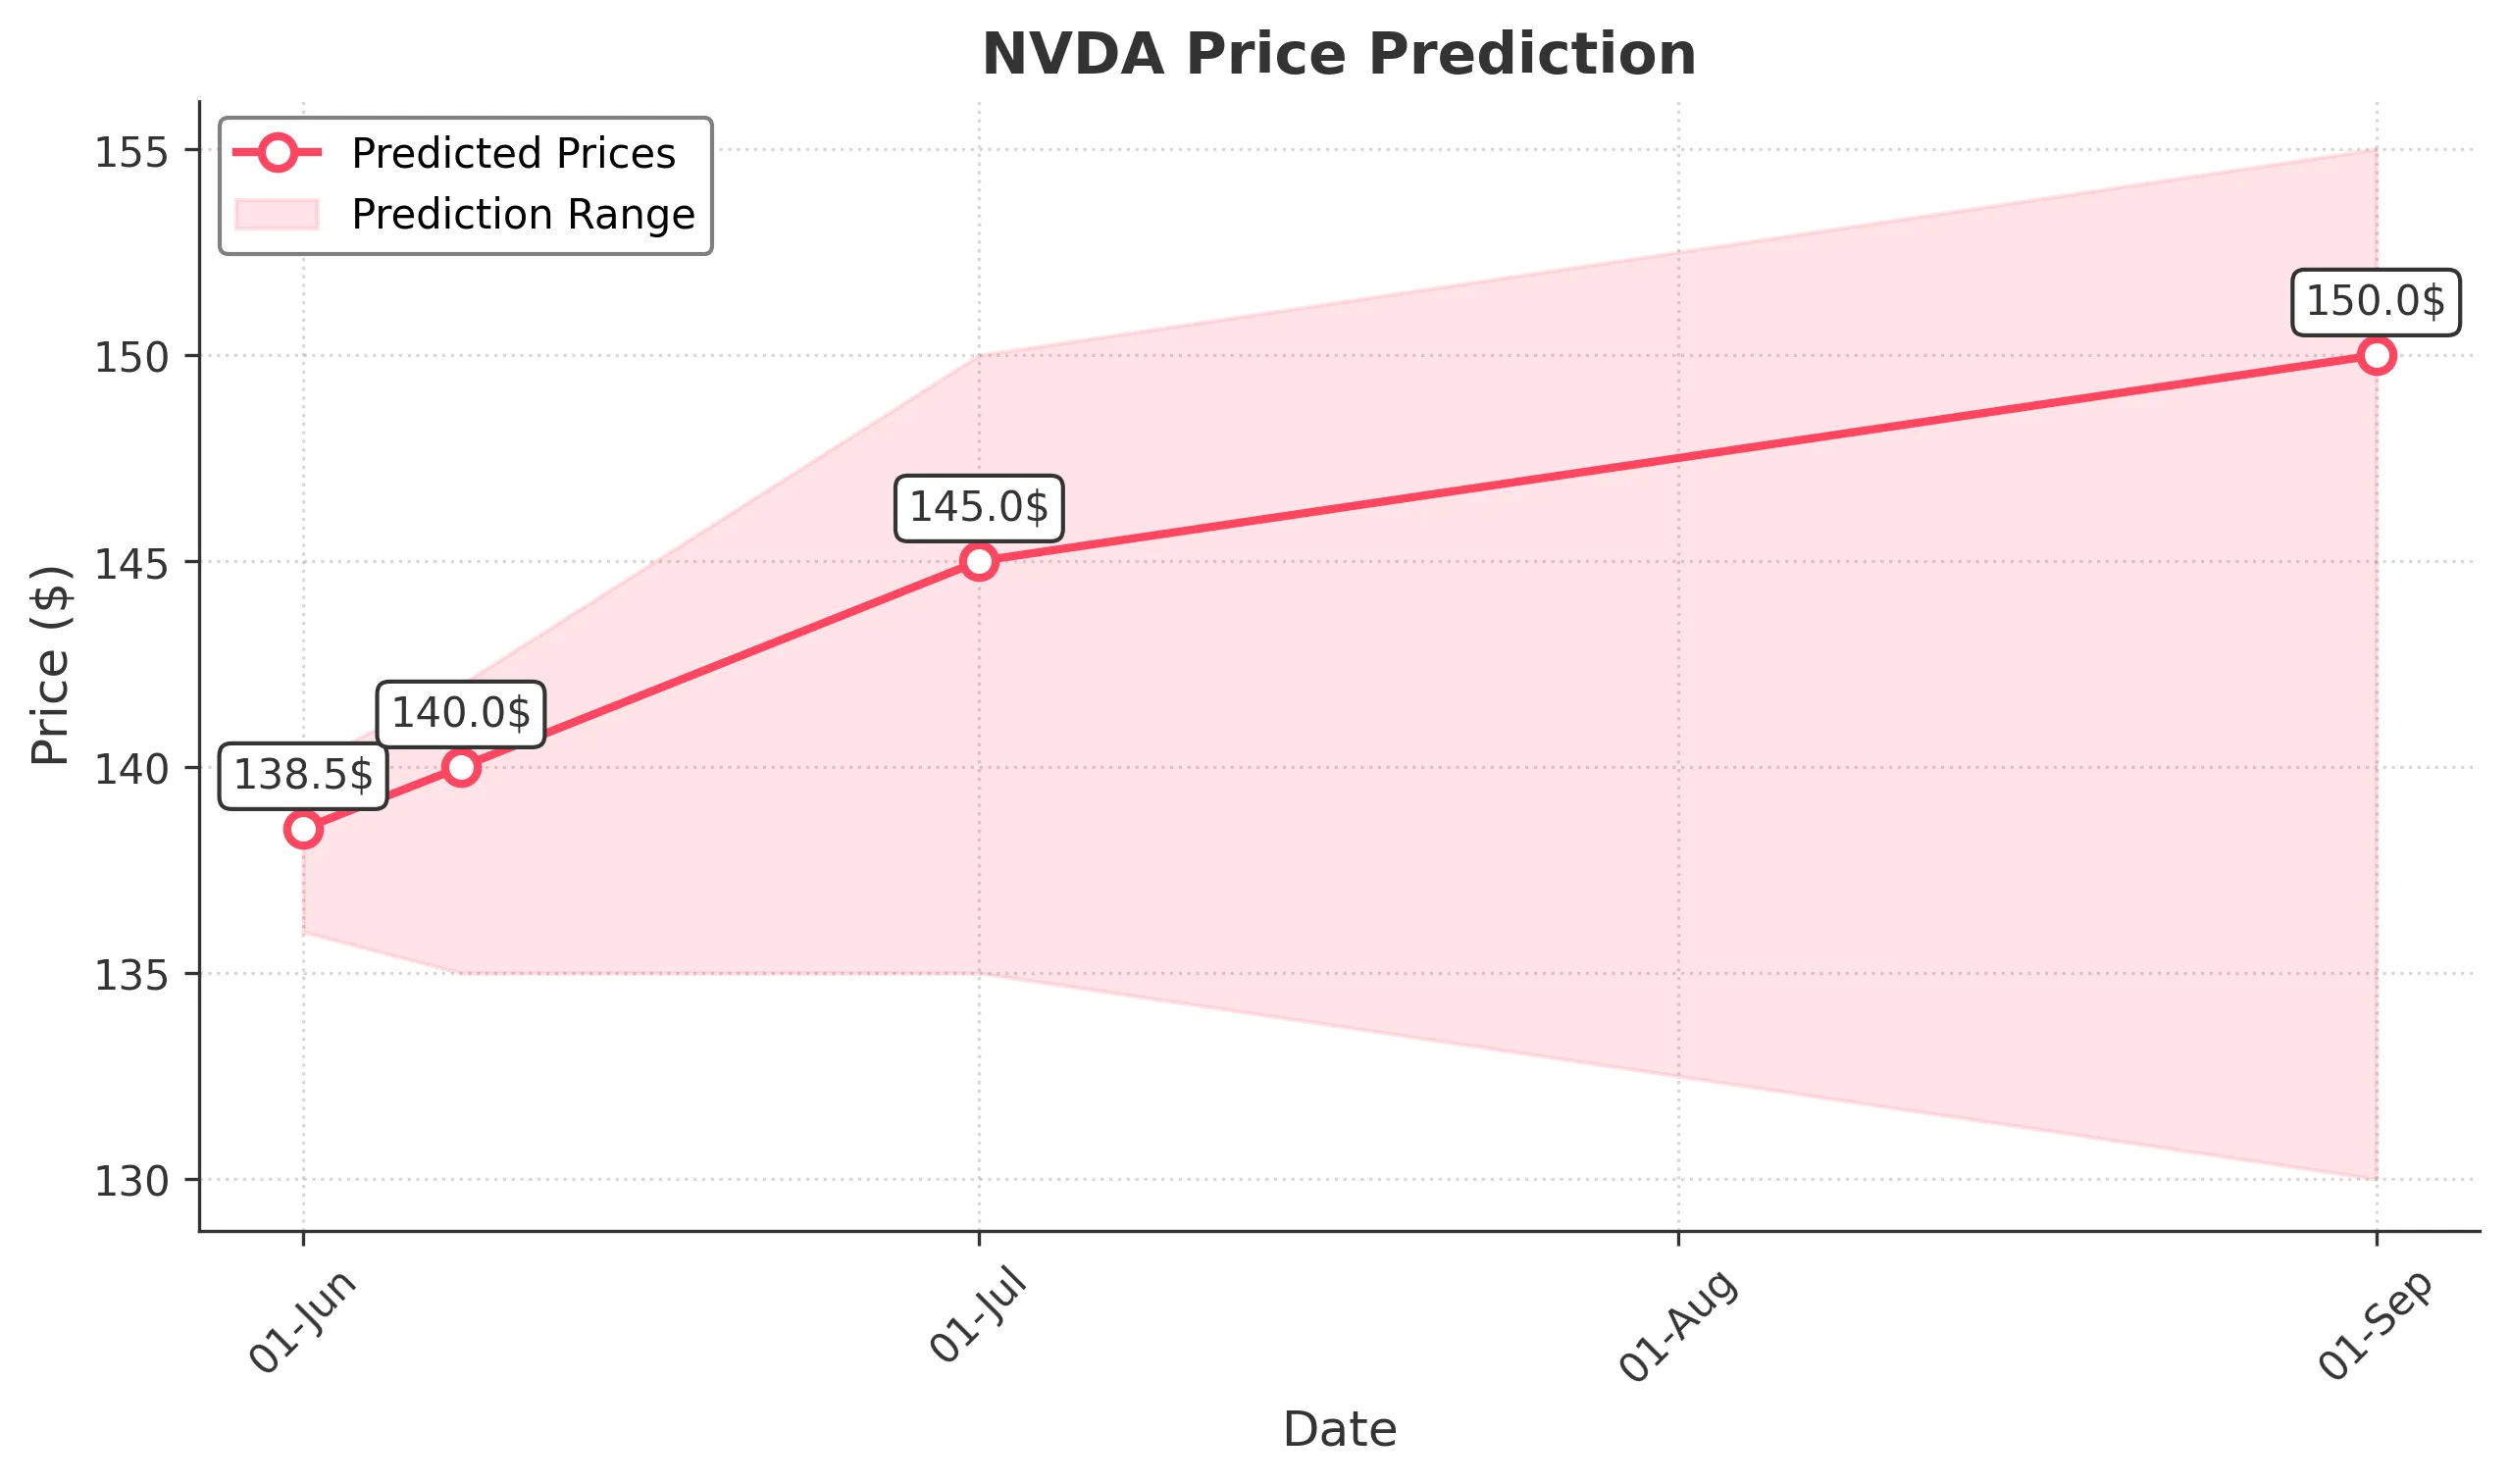
Target: June 1, 2025$138.5
$137
$140
$136
Description
The stock shows bullish momentum with a recent upward trend. The RSI is approaching overbought levels, indicating potential for a pullback. However, strong buying volume suggests continued interest. Watch for resistance at $140.
Analysis
Over the past 3 months, NVDA has shown a bullish trend with significant support at $130 and resistance around $140. The recent increase in volume indicates strong buying interest. However, the RSI nearing overbought levels suggests caution.
Confidence Level
Potential Risks
Potential market volatility and profit-taking could lead to a price drop.
1 Week Prediction
Target: June 8, 2025$140
$138.5
$142
$135
Description
The stock is expected to continue its upward trajectory, supported by strong fundamentals and positive market sentiment. However, the RSI indicates potential overbought conditions, which could lead to a pullback.
Analysis
NVDA has been on a bullish run, with key support at $130 and resistance at $140. The MACD shows bullish momentum, but the RSI suggests caution as it approaches overbought territory. Volume spikes indicate strong interest.
Confidence Level
Potential Risks
Market corrections or negative news could impact the stock's performance.
1 Month Prediction
Target: July 1, 2025$145
$140
$150
$135
Description
With continued bullish sentiment and strong earnings reports, NVDA is likely to reach new highs. However, the market's volatility and potential profit-taking could lead to fluctuations.
Analysis
The stock has shown a strong upward trend, with significant support at $130. The MACD indicates bullish momentum, but the RSI suggests caution. Volume patterns show increased interest, but external factors could introduce volatility.
Confidence Level
Potential Risks
Economic factors and market sentiment shifts could affect the stock's trajectory.
3 Months Prediction
Target: September 1, 2025$150
$145
$155
$130
Description
If the current bullish trend continues, NVDA could reach $150. However, macroeconomic factors and potential market corrections pose risks to this prediction.
Analysis
The stock has been on a bullish trend, with key support at $130 and resistance at $150. The MACD shows bullish momentum, but the RSI indicates potential overbought conditions. Volume patterns suggest strong interest, but external factors could introduce volatility.
Confidence Level
Potential Risks
Unforeseen economic events or shifts in market sentiment could lead to significant price changes.