NVDA Trading Predictions
1 Day Prediction
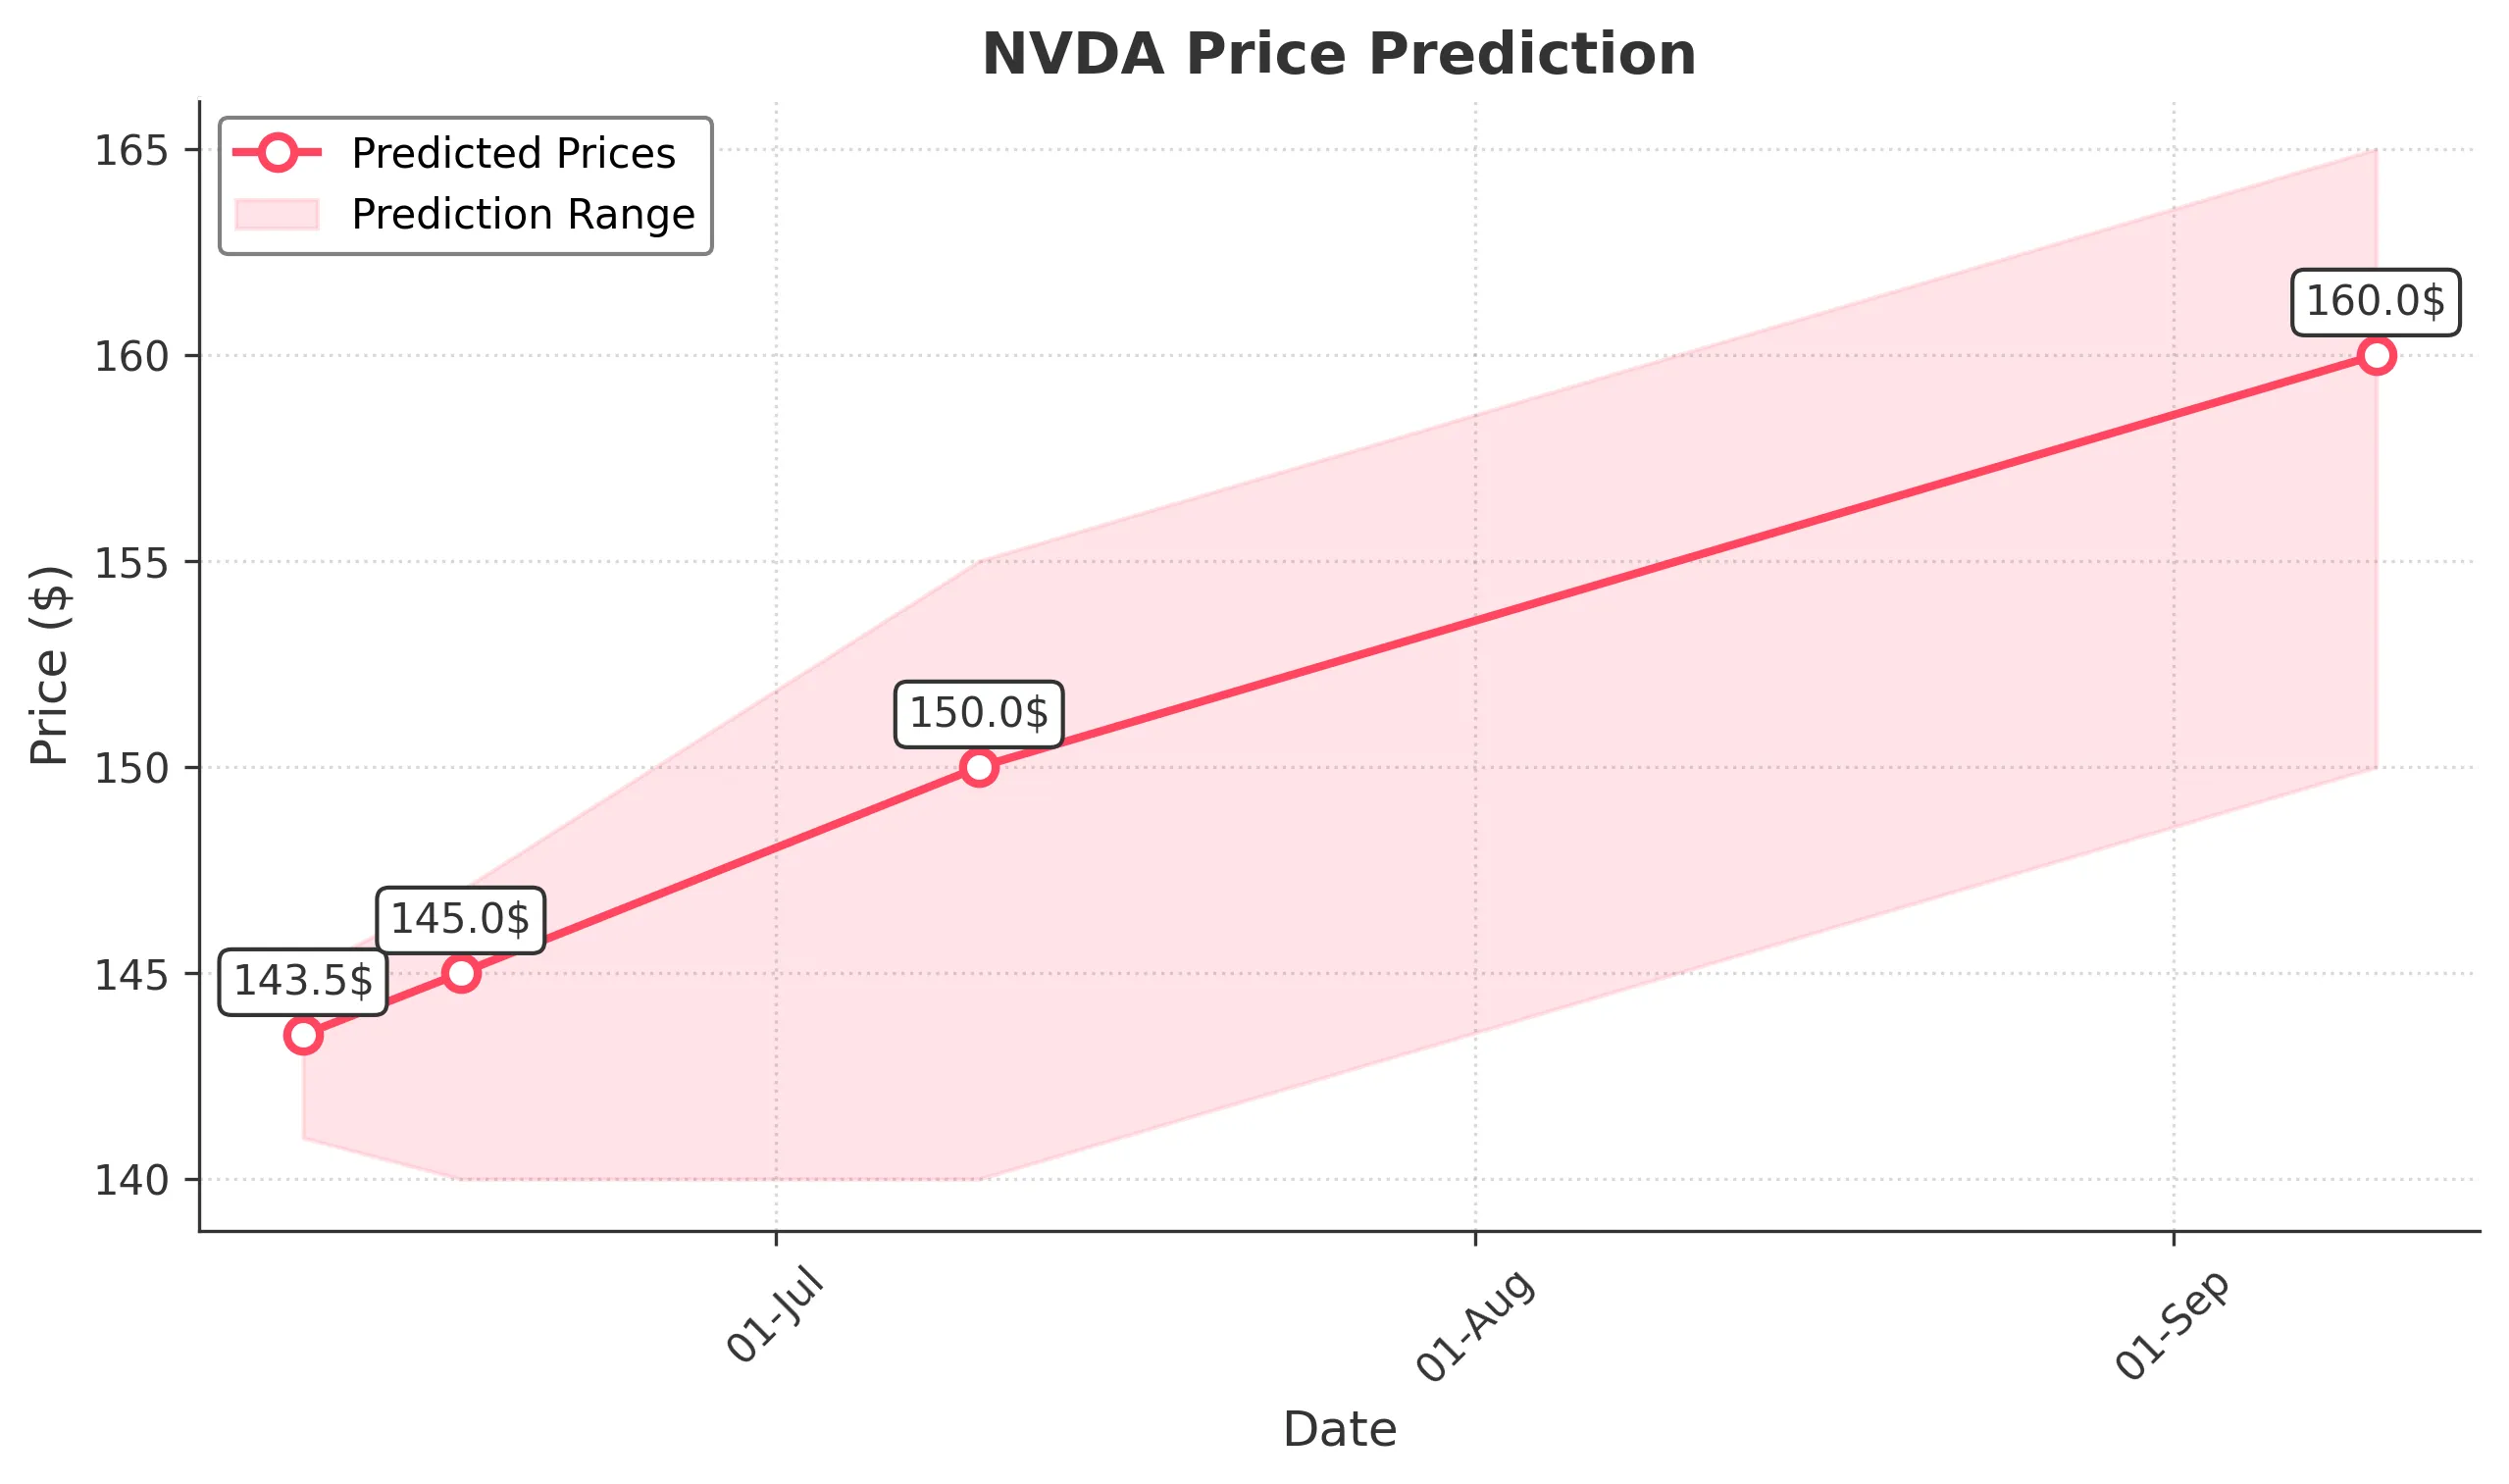
Target: June 10, 2025$143.5
$143
$145
$141
Description
The stock shows bullish momentum with a recent upward trend. The RSI is approaching overbought levels, indicating potential for a pullback. However, strong volume and positive market sentiment suggest a close around 143.50.
Analysis
Over the past 3 months, NVDA has shown a bullish trend with significant support at $130 and resistance at $145. The recent price action indicates strong buying interest, but the RSI nearing overbought levels raises concerns about a possible correction.
Confidence Level
Potential Risks
Potential for a pullback due to overbought RSI and market volatility.
1 Week Prediction
Target: June 17, 2025$145
$143.5
$147
$140
Description
The stock is expected to continue its upward trajectory, supported by strong volume and bullish candlestick patterns. However, the RSI indicates potential overbought conditions, which could lead to volatility.
Analysis
NVDA has maintained a bullish trend with key support at $130 and resistance at $145. The MACD is bullish, but the RSI suggests caution. Volume spikes indicate strong interest, but external factors could introduce volatility.
Confidence Level
Potential Risks
Market sentiment could shift due to macroeconomic factors, impacting the stock's performance.
1 Month Prediction
Target: July 10, 2025$150
$145
$155
$140
Description
With continued bullish momentum and strong market sentiment, NVDA is likely to reach $150. The Fibonacci retracement levels support this target, but overbought conditions may lead to corrections.
Analysis
The stock has shown a strong upward trend, with significant support at $130 and resistance at $155. The MACD remains bullish, but the RSI indicates overbought conditions. Volume trends suggest strong buying interest, but macroeconomic events could introduce volatility.
Confidence Level
Potential Risks
Potential market corrections and external economic factors could impact the stock's trajectory.
3 Months Prediction
Target: September 10, 2025$160
$155
$165
$150
Description
Assuming continued bullish sentiment and strong fundamentals, NVDA could reach $160. However, potential market corrections and economic uncertainties may pose risks.
Analysis
Over the past 3 months, NVDA has shown a strong bullish trend with key support at $130 and resistance at $165. The MACD is bullish, but the RSI indicates potential overbought conditions. Volume patterns suggest strong interest, but external factors could introduce volatility.
Confidence Level
Potential Risks
Market volatility and economic conditions could lead to unexpected price movements.