NVDA Trading Predictions
1 Day Prediction
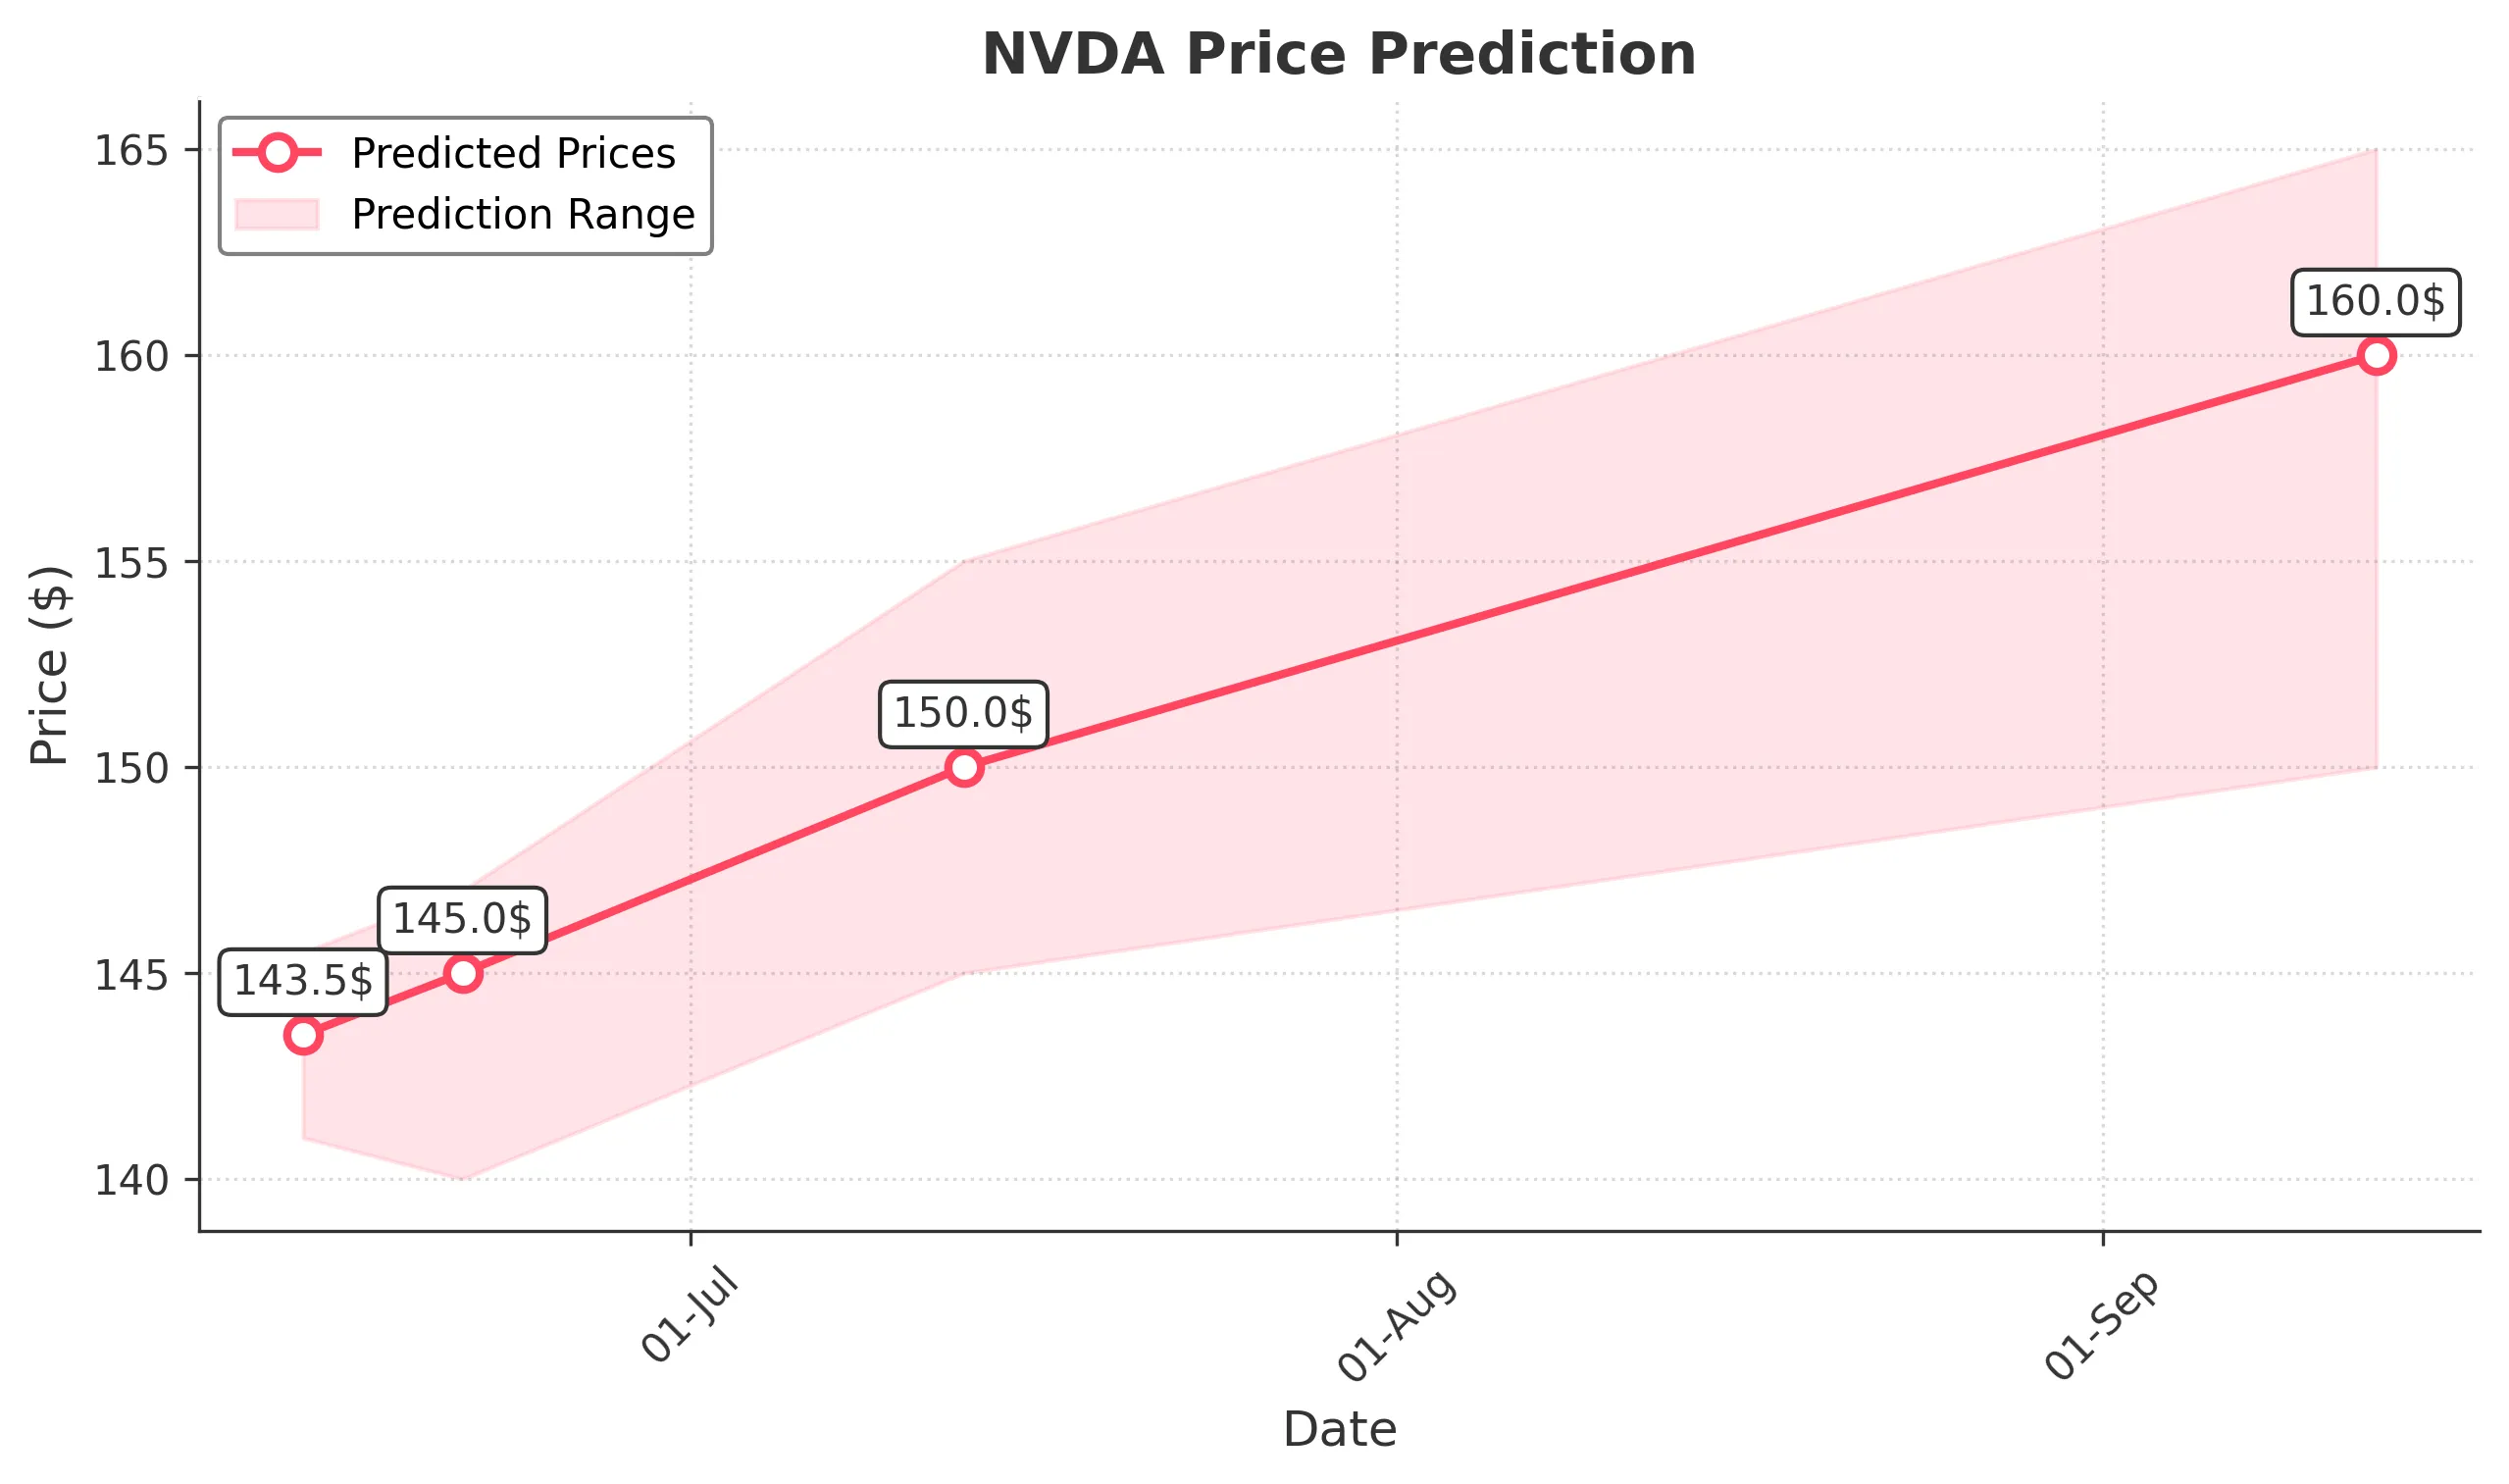
Target: June 14, 2025$143.5
$142.8
$145.5
$141
Description
The stock shows a bullish trend with a recent upward movement. The RSI is approaching overbought levels, indicating potential consolidation. A Doji pattern suggests indecision, but overall momentum remains positive. Volume is expected to be moderate.
Analysis
Over the past 3 months, NVDA has shown a bullish trend with significant support at $140. Recent price action indicates strong buying interest, but RSI nearing overbought levels suggests caution. Volume spikes on up days indicate strong interest, while recent candlestick patterns show some indecision.
Confidence Level
Potential Risks
Potential market volatility and profit-taking could lead to a pullback.
1 Week Prediction
Target: June 21, 2025$145
$143.5
$147
$140
Description
The stock is expected to continue its upward trajectory, supported by strong buying momentum. The MACD is bullish, and the price is above the 50-day moving average. However, the RSI indicates potential overbought conditions, suggesting a possible pullback.
Analysis
NVDA has maintained a bullish trend with key support at $140. The recent price action shows strong buying, but the RSI indicates overbought conditions. Volume patterns suggest sustained interest, but external factors could introduce volatility.
Confidence Level
Potential Risks
Market sentiment could shift due to macroeconomic news or earnings reports, impacting price.
1 Month Prediction
Target: July 13, 2025$150
$145.5
$155
$145
Description
The stock is likely to reach new highs as bullish sentiment persists. The Fibonacci retracement levels indicate strong support at $145, and the MACD remains bullish. However, the RSI suggests caution as it approaches overbought territory.
Analysis
In the last three months, NVDA has shown a strong bullish trend with significant resistance at $155. The stock's performance has been supported by strong volume and positive technical indicators, but caution is warranted as the RSI nears overbought levels.
Confidence Level
Potential Risks
Potential market corrections or negative news could impact the upward trend.
3 Months Prediction
Target: September 13, 2025$160
$155
$165
$150
Description
The stock is expected to continue its upward trend, driven by strong fundamentals and market sentiment. The MACD remains bullish, and the price is above key moving averages. However, external economic factors could introduce volatility.
Analysis
NVDA has shown a consistent bullish trend over the past three months, with key support at $150. The stock's performance is bolstered by strong volume and positive technical indicators, but potential market corrections and external factors could impact future performance.
Confidence Level
Potential Risks
Unforeseen macroeconomic events or earnings surprises could lead to significant price fluctuations.