NVDA Trading Predictions
1 Day Prediction
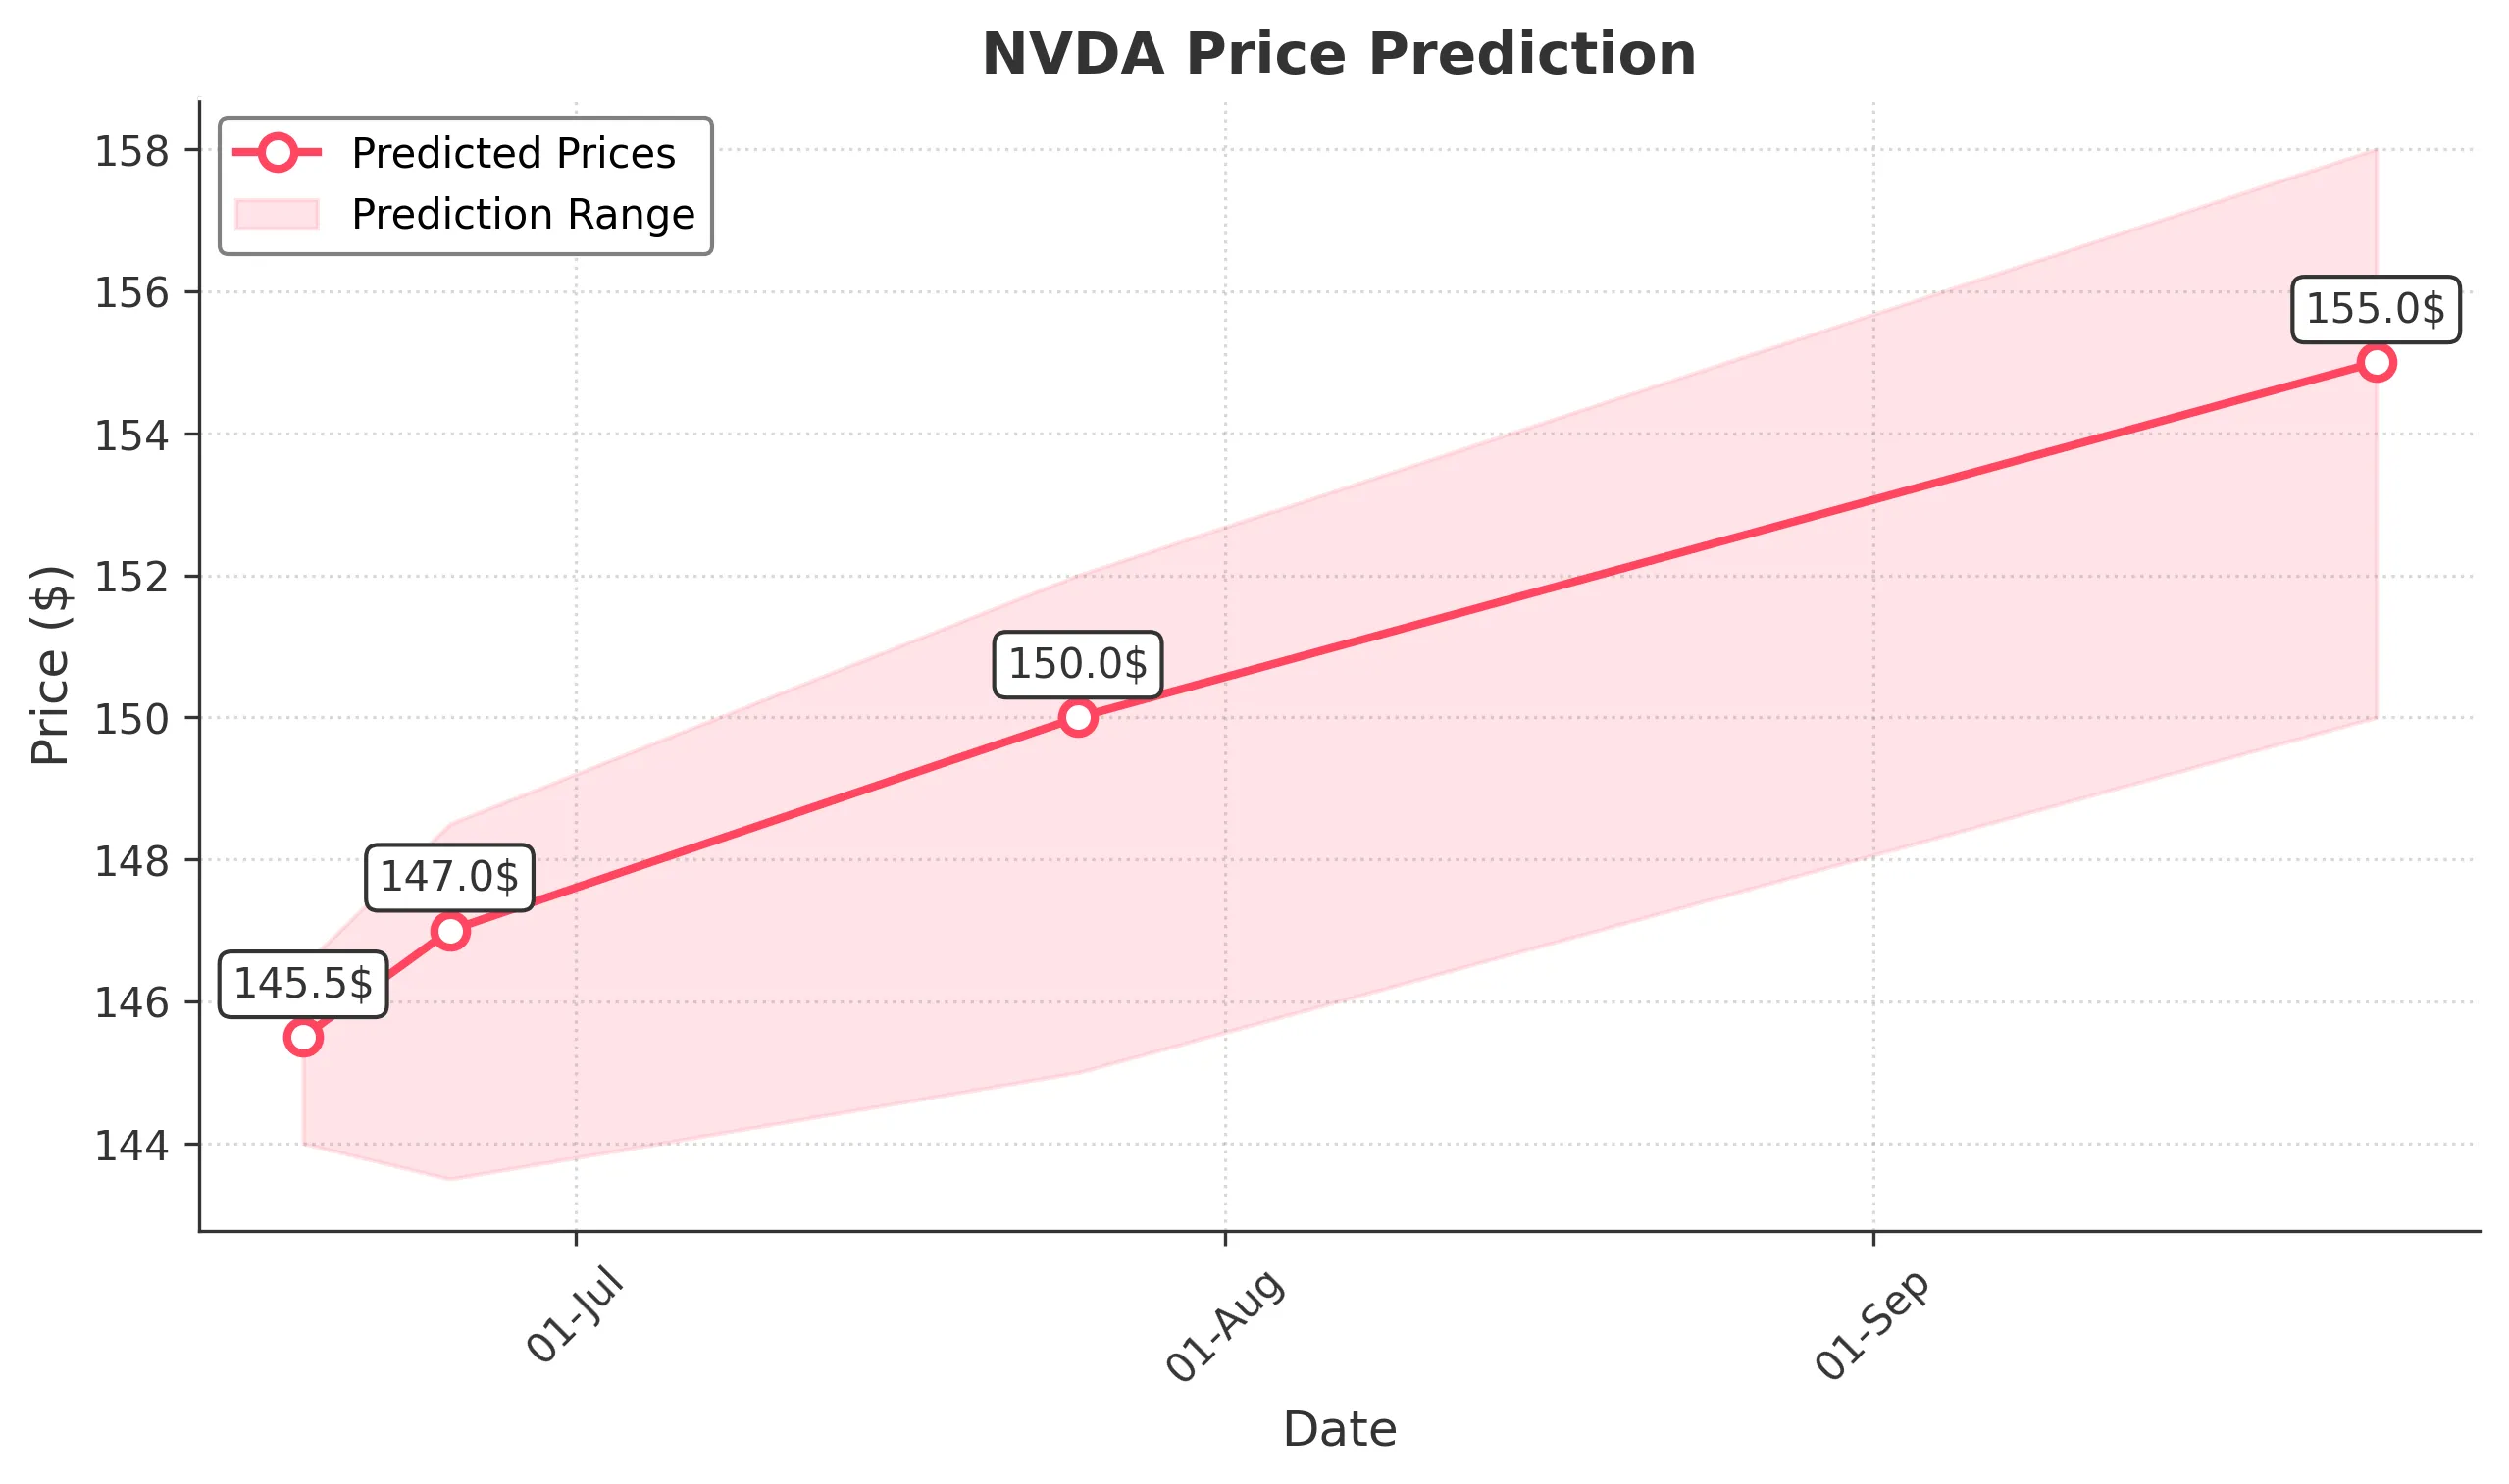
Target: June 18, 2025$145.5
$145
$146.5
$144
Description
The stock shows bullish momentum with a recent upward trend. The RSI is approaching overbought levels, indicating potential for a pullback. However, strong support at 144.00 and positive market sentiment suggest a slight increase in price.
Analysis
Over the past 3 months, NVDA has shown a bullish trend with significant support at 144.00. The MACD indicates upward momentum, while the RSI is nearing overbought territory. Volume has been stable, but spikes on up days suggest strong buying interest.
Confidence Level
Potential Risks
Potential market volatility and profit-taking could lead to a reversal.
1 Week Prediction
Target: June 25, 2025$147
$145.5
$148.5
$143.5
Description
The stock is expected to continue its upward trajectory, supported by recent bullish candlestick patterns. The MACD remains positive, and the Bollinger Bands indicate potential for further price expansion. However, watch for resistance at 148.50.
Analysis
NVDA has been in a bullish phase, with key support at 144.00. The recent price action shows strong buying interest, but the RSI indicates potential overbought conditions. Volume patterns suggest sustained interest, but external factors could introduce volatility.
Confidence Level
Potential Risks
Market corrections or negative news could impact the upward trend.
1 Month Prediction
Target: July 25, 2025$150
$147
$152
$145
Description
With continued bullish sentiment and strong technical indicators, NVDA is likely to reach 150.00. The Fibonacci retracement levels support this target, but caution is advised as the RSI may indicate overbought conditions.
Analysis
The stock has shown a consistent upward trend, with significant resistance at 152.00. The MACD and moving averages support further gains, but the RSI suggests caution. Volume has been increasing, indicating strong interest, but external factors could introduce risk.
Confidence Level
Potential Risks
Market sentiment shifts or earnings reports could lead to unexpected price movements.
3 Months Prediction
Target: September 25, 2025$155
$152
$158
$150
Description
Assuming continued market strength and positive earnings, NVDA could reach 155.00. The technical indicators suggest a bullish outlook, but potential market corrections and economic factors could pose risks.
Analysis
Over the last three months, NVDA has shown a strong bullish trend, with key support at 150.00. The MACD and moving averages indicate upward momentum, but the RSI is approaching overbought levels. Volume patterns suggest strong interest, but external economic factors could introduce volatility.
Confidence Level
Potential Risks
Economic downturns or sector-specific issues could negatively impact the stock's performance.