NVDA Trading Predictions
1 Day Prediction
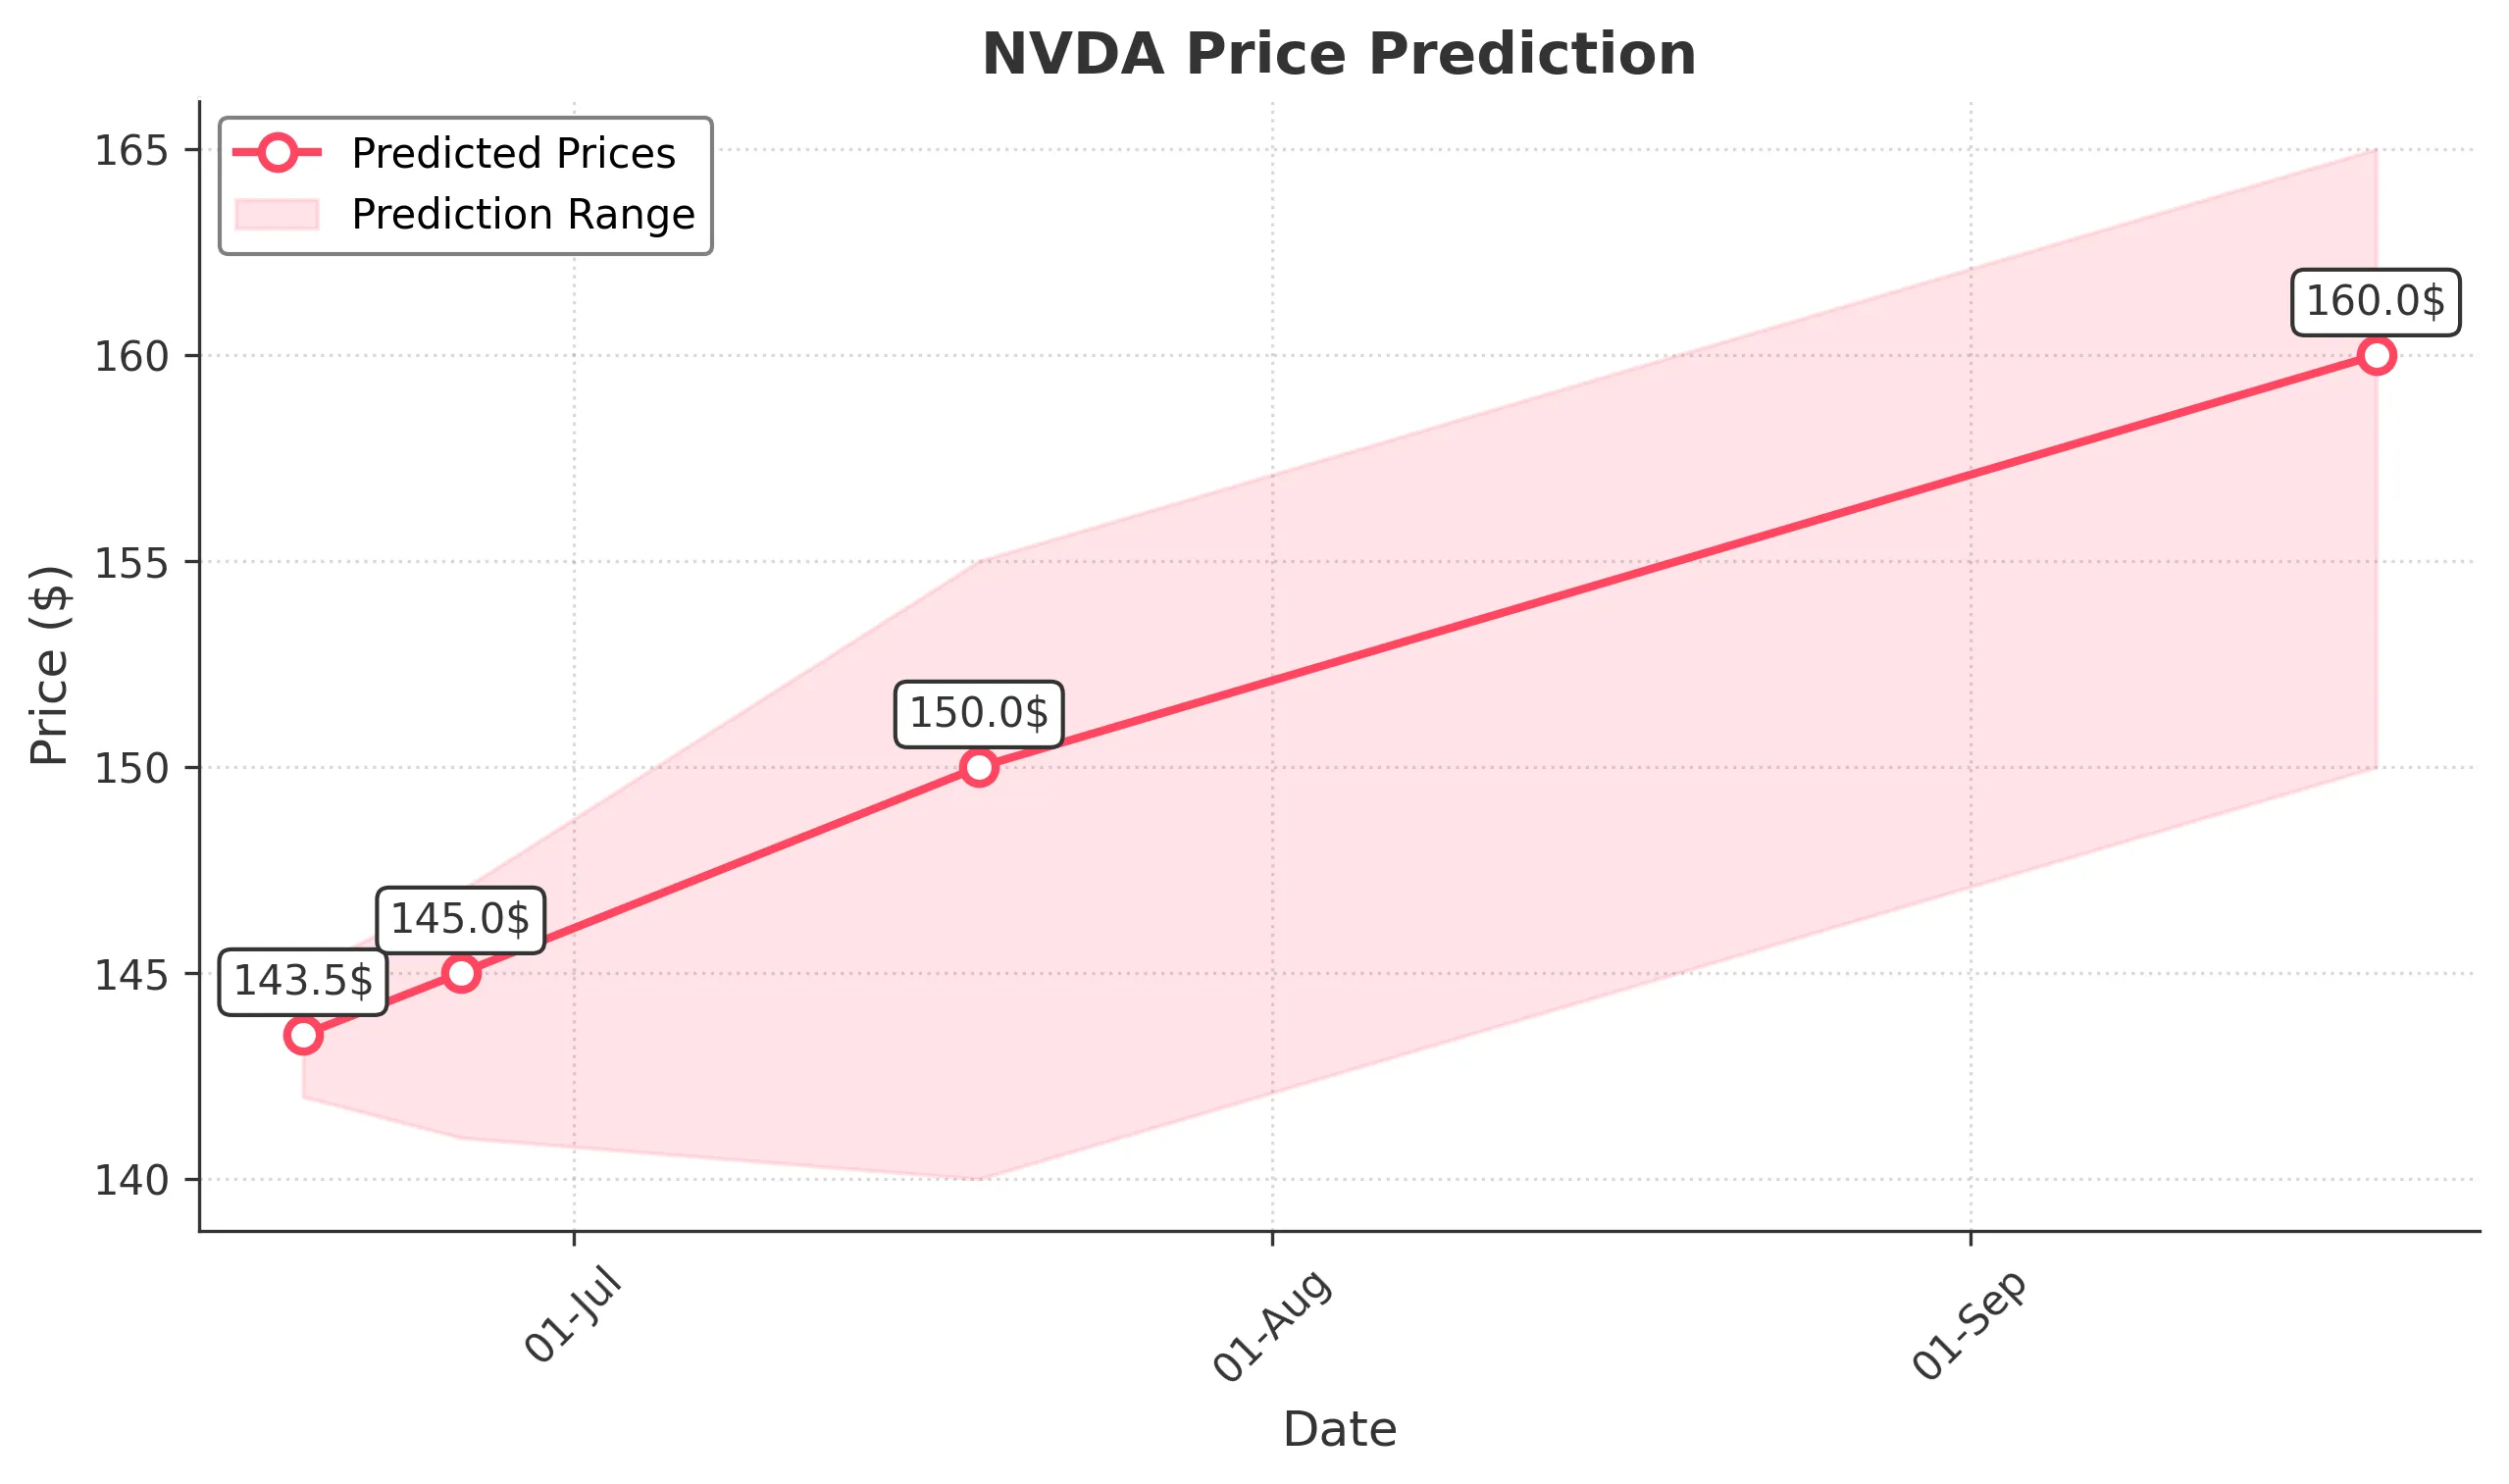
Target: June 19, 2025$143.5
$144
$145
$142
Description
The stock shows a slight bullish trend with a recent Doji candlestick indicating indecision. The RSI is neutral, and MACD is close to crossing above the signal line, suggesting potential upward momentum. However, volatility remains a concern.
Analysis
Over the past 3 months, NVDA has shown a bullish trend with significant support at $140 and resistance around $145. The recent price action indicates a potential consolidation phase. Volume spikes on up days suggest strong buying interest, while the ATR indicates moderate volatility.
Confidence Level
Potential Risks
Market sentiment could shift due to macroeconomic news or earnings reports, which may impact the stock's performance.
1 Week Prediction
Target: June 26, 2025$145
$143.5
$147
$141
Description
The stock is expected to maintain its upward trajectory, supported by bullish momentum from the MACD and a favorable RSI. However, the proximity to resistance levels may lead to profit-taking, creating potential volatility.
Analysis
The stock has been in a bullish phase, with key support at $140 and resistance at $145. The recent price action shows a series of higher lows, indicating a strong buying interest. However, the market remains sensitive to external news, which could impact future performance.
Confidence Level
Potential Risks
External factors such as economic data releases or geopolitical events could lead to unexpected price movements.
1 Month Prediction
Target: July 19, 2025$150
$145
$155
$140
Description
With a bullish trend supported by strong volume and positive technical indicators, NVDA is likely to reach $150. The MACD and RSI suggest continued upward momentum, but caution is advised as the stock approaches resistance levels.
Analysis
The stock has shown a strong bullish trend with significant support at $140. The recent price action indicates a healthy demand, and the technical indicators support further gains. However, the market's reaction to earnings reports or economic data could introduce volatility.
Confidence Level
Potential Risks
Potential market corrections or negative news could hinder upward movement, leading to increased volatility.
3 Months Prediction
Target: September 19, 2025$160
$155
$165
$150
Description
The stock is expected to continue its upward trend, driven by strong fundamentals and positive market sentiment. However, the approach to key resistance levels may lead to increased volatility and profit-taking.
Analysis
NVDA has demonstrated a strong bullish trend over the past three months, with key support at $140 and resistance at $155. The technical indicators suggest continued upward momentum, but external factors could introduce volatility. The market sentiment remains cautiously optimistic.
Confidence Level
Potential Risks
Market corrections or unexpected economic events could impact the stock's trajectory, leading to potential downward adjustments.