NVDA Trading Predictions
1 Day Prediction
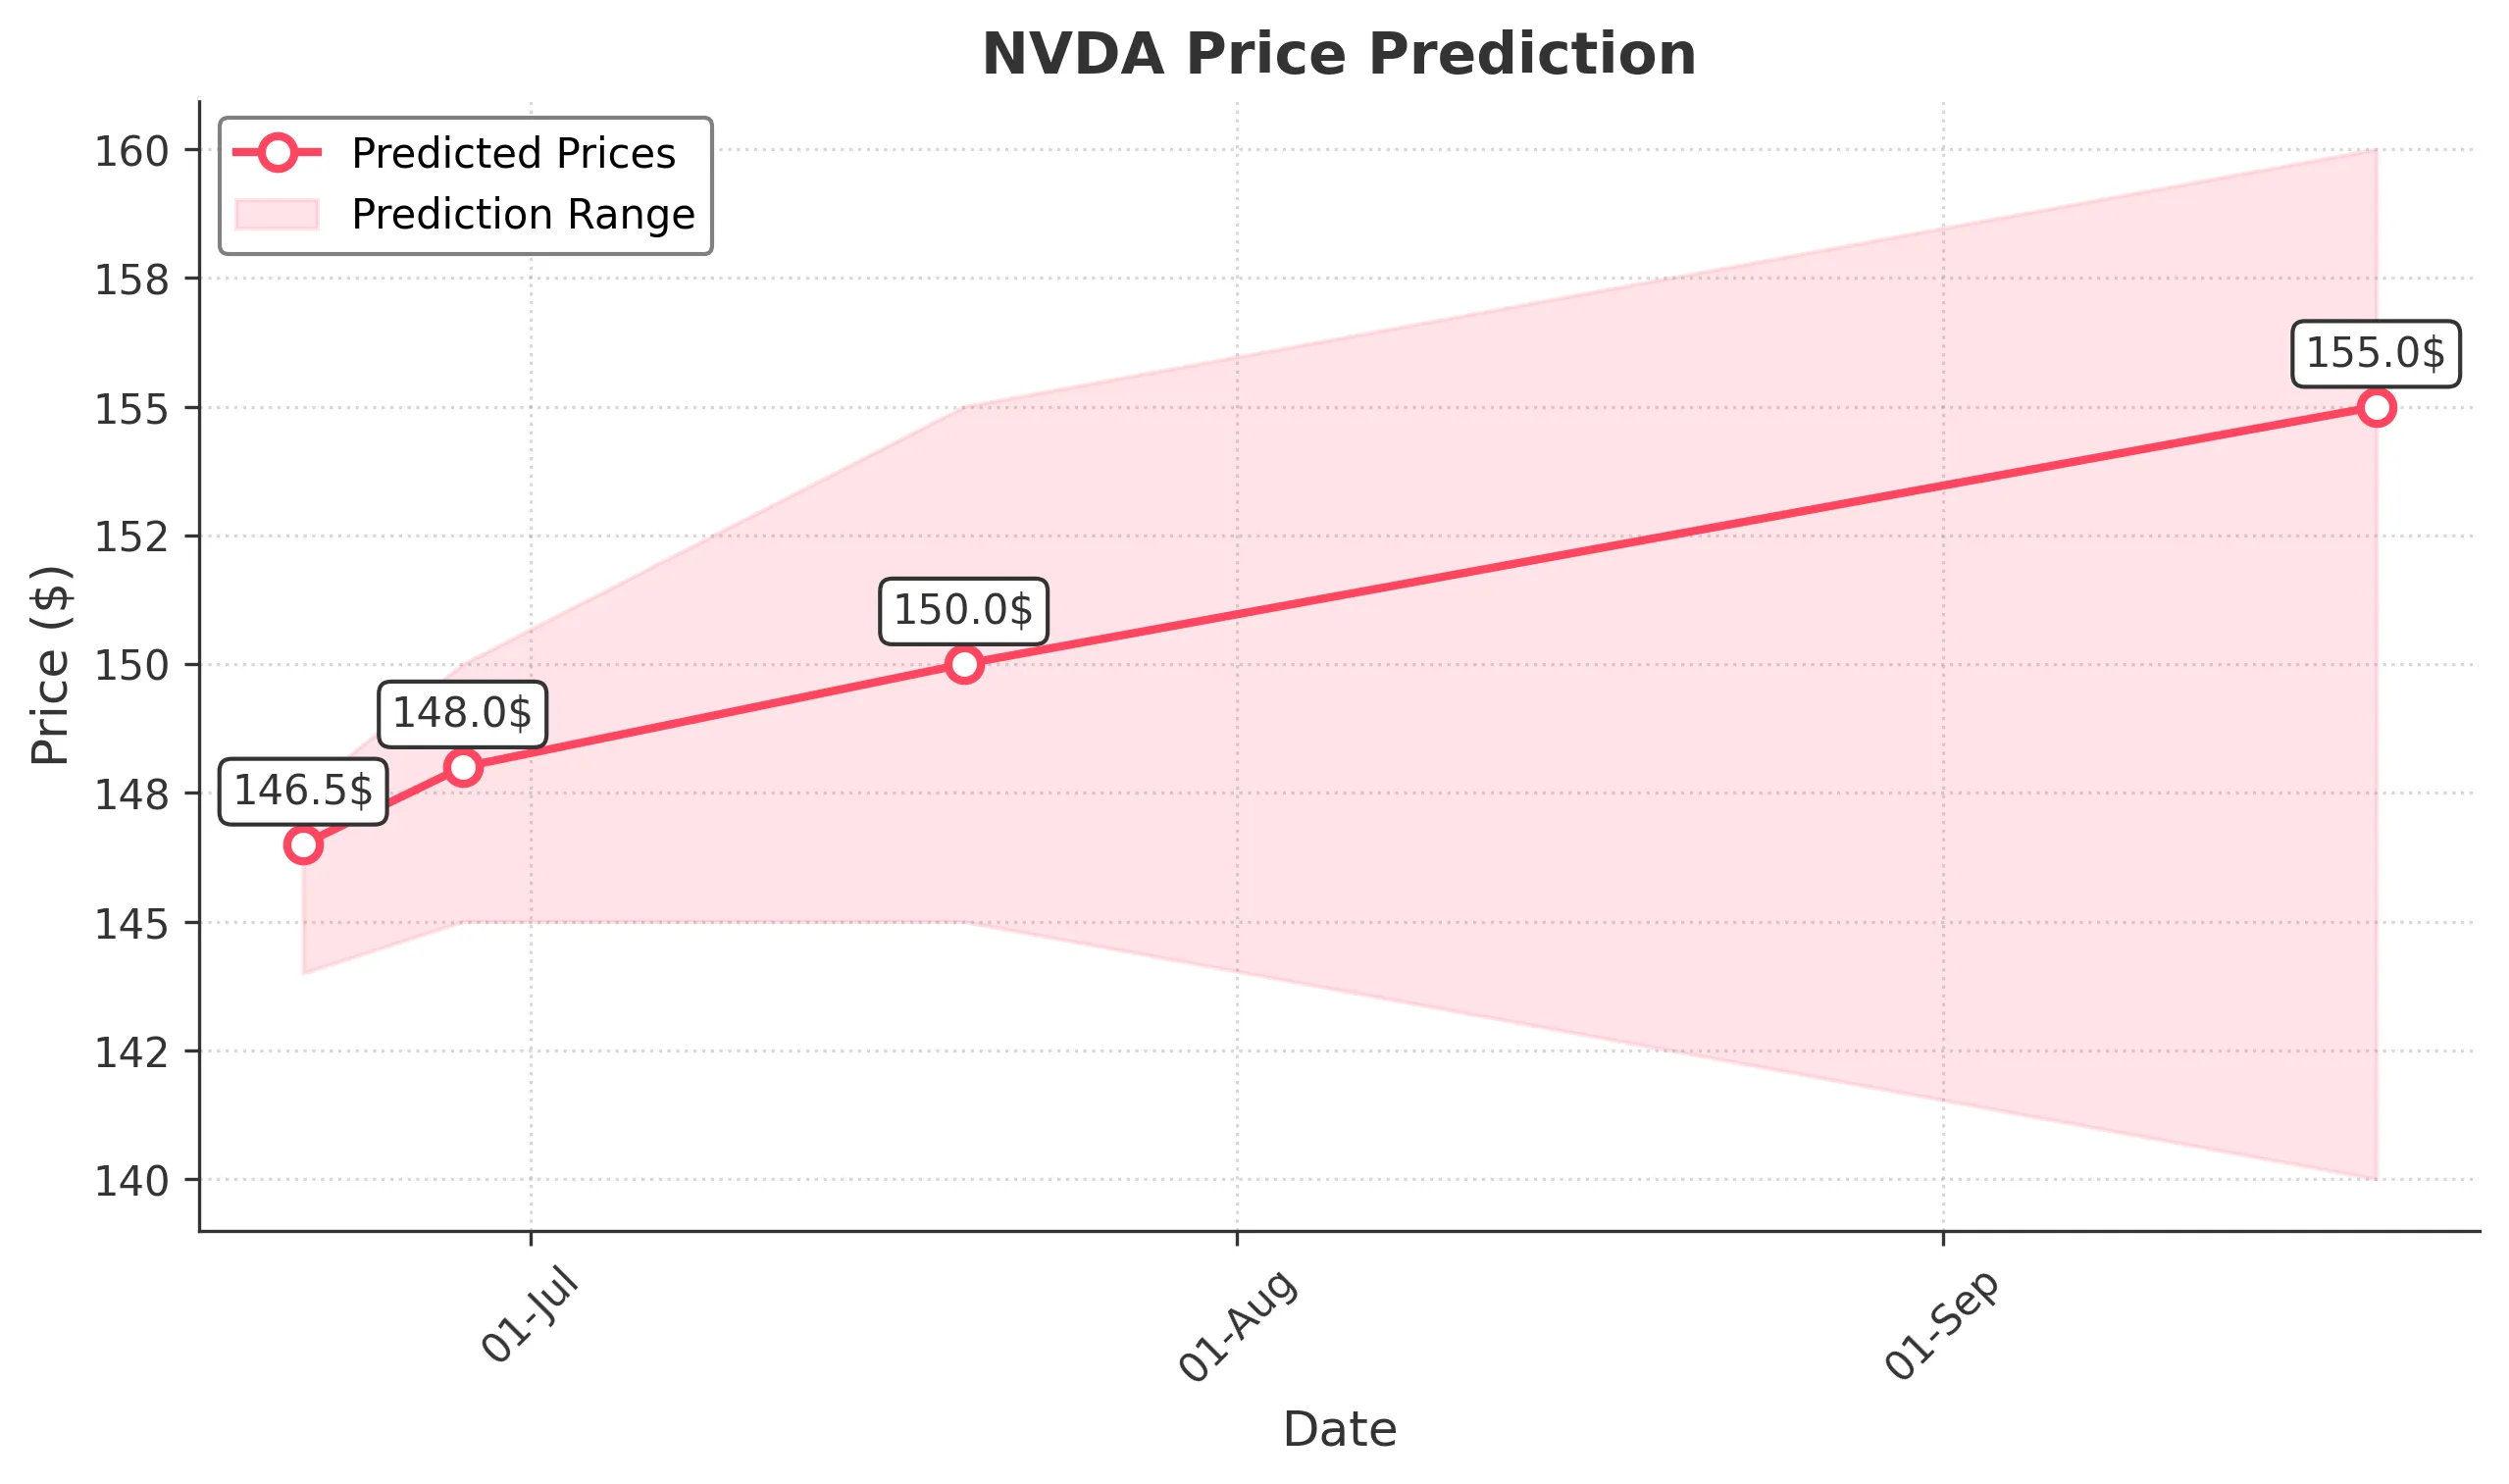
Target: June 21, 2025$146.5
$145.9
$147.5
$144
Description
The stock shows bullish momentum with a recent close above the 50-day moving average. RSI is at 65, indicating strength. A Doji pattern suggests indecision, but overall sentiment remains positive. Expect slight upward movement.
Analysis
Over the past 3 months, NVDA has shown a bullish trend with significant support at $140. Recent volume spikes indicate strong buying interest. The MACD is bullish, and the stock is trading near its upper Bollinger Band, suggesting potential for a pullback.
Confidence Level
Potential Risks
Potential market volatility could impact the prediction, especially if external news arises.
1 Week Prediction
Target: June 28, 2025$148
$146.5
$150
$145
Description
The stock is expected to continue its upward trend, supported by strong volume and bullish indicators. The MACD remains positive, and the RSI is approaching overbought territory, indicating potential for a pullback.
Analysis
NVDA has been in a bullish phase, with resistance at $150. The recent price action shows a strong upward trend, but the RSI nearing 70 suggests caution. Volume patterns indicate sustained interest, but external factors could introduce volatility.
Confidence Level
Potential Risks
Market corrections or negative news could lead to unexpected price movements.
1 Month Prediction
Target: July 20, 2025$150
$148
$155
$145
Description
The stock is likely to reach $150, driven by strong fundamentals and market sentiment. However, the RSI indicates overbought conditions, suggesting a possible correction. Watch for resistance at $155.
Analysis
In the last three months, NVDA has shown a strong bullish trend with key support at $140. The MACD is bullish, but the stock is approaching overbought levels. Volume has been robust, indicating strong interest, but caution is warranted as the market can be unpredictable.
Confidence Level
Potential Risks
Market sentiment can shift quickly, and any negative news could impact the stock's performance.
3 Months Prediction
Target: September 20, 2025$155
$150
$160
$140
Description
Expect continued growth towards $155, supported by strong fundamentals and market trends. However, potential resistance at $160 may lead to volatility. Monitor for any bearish signals.
Analysis
NVDA has maintained a bullish trend, with significant support at $140 and resistance at $160. The stock's performance has been strong, but external economic factors and market sentiment could introduce volatility. The MACD is bullish, but caution is advised as the stock approaches overbought territory.
Confidence Level
Potential Risks
Economic conditions and market sentiment can change rapidly, affecting the stock's trajectory.