NVDA Trading Predictions
1 Day Prediction
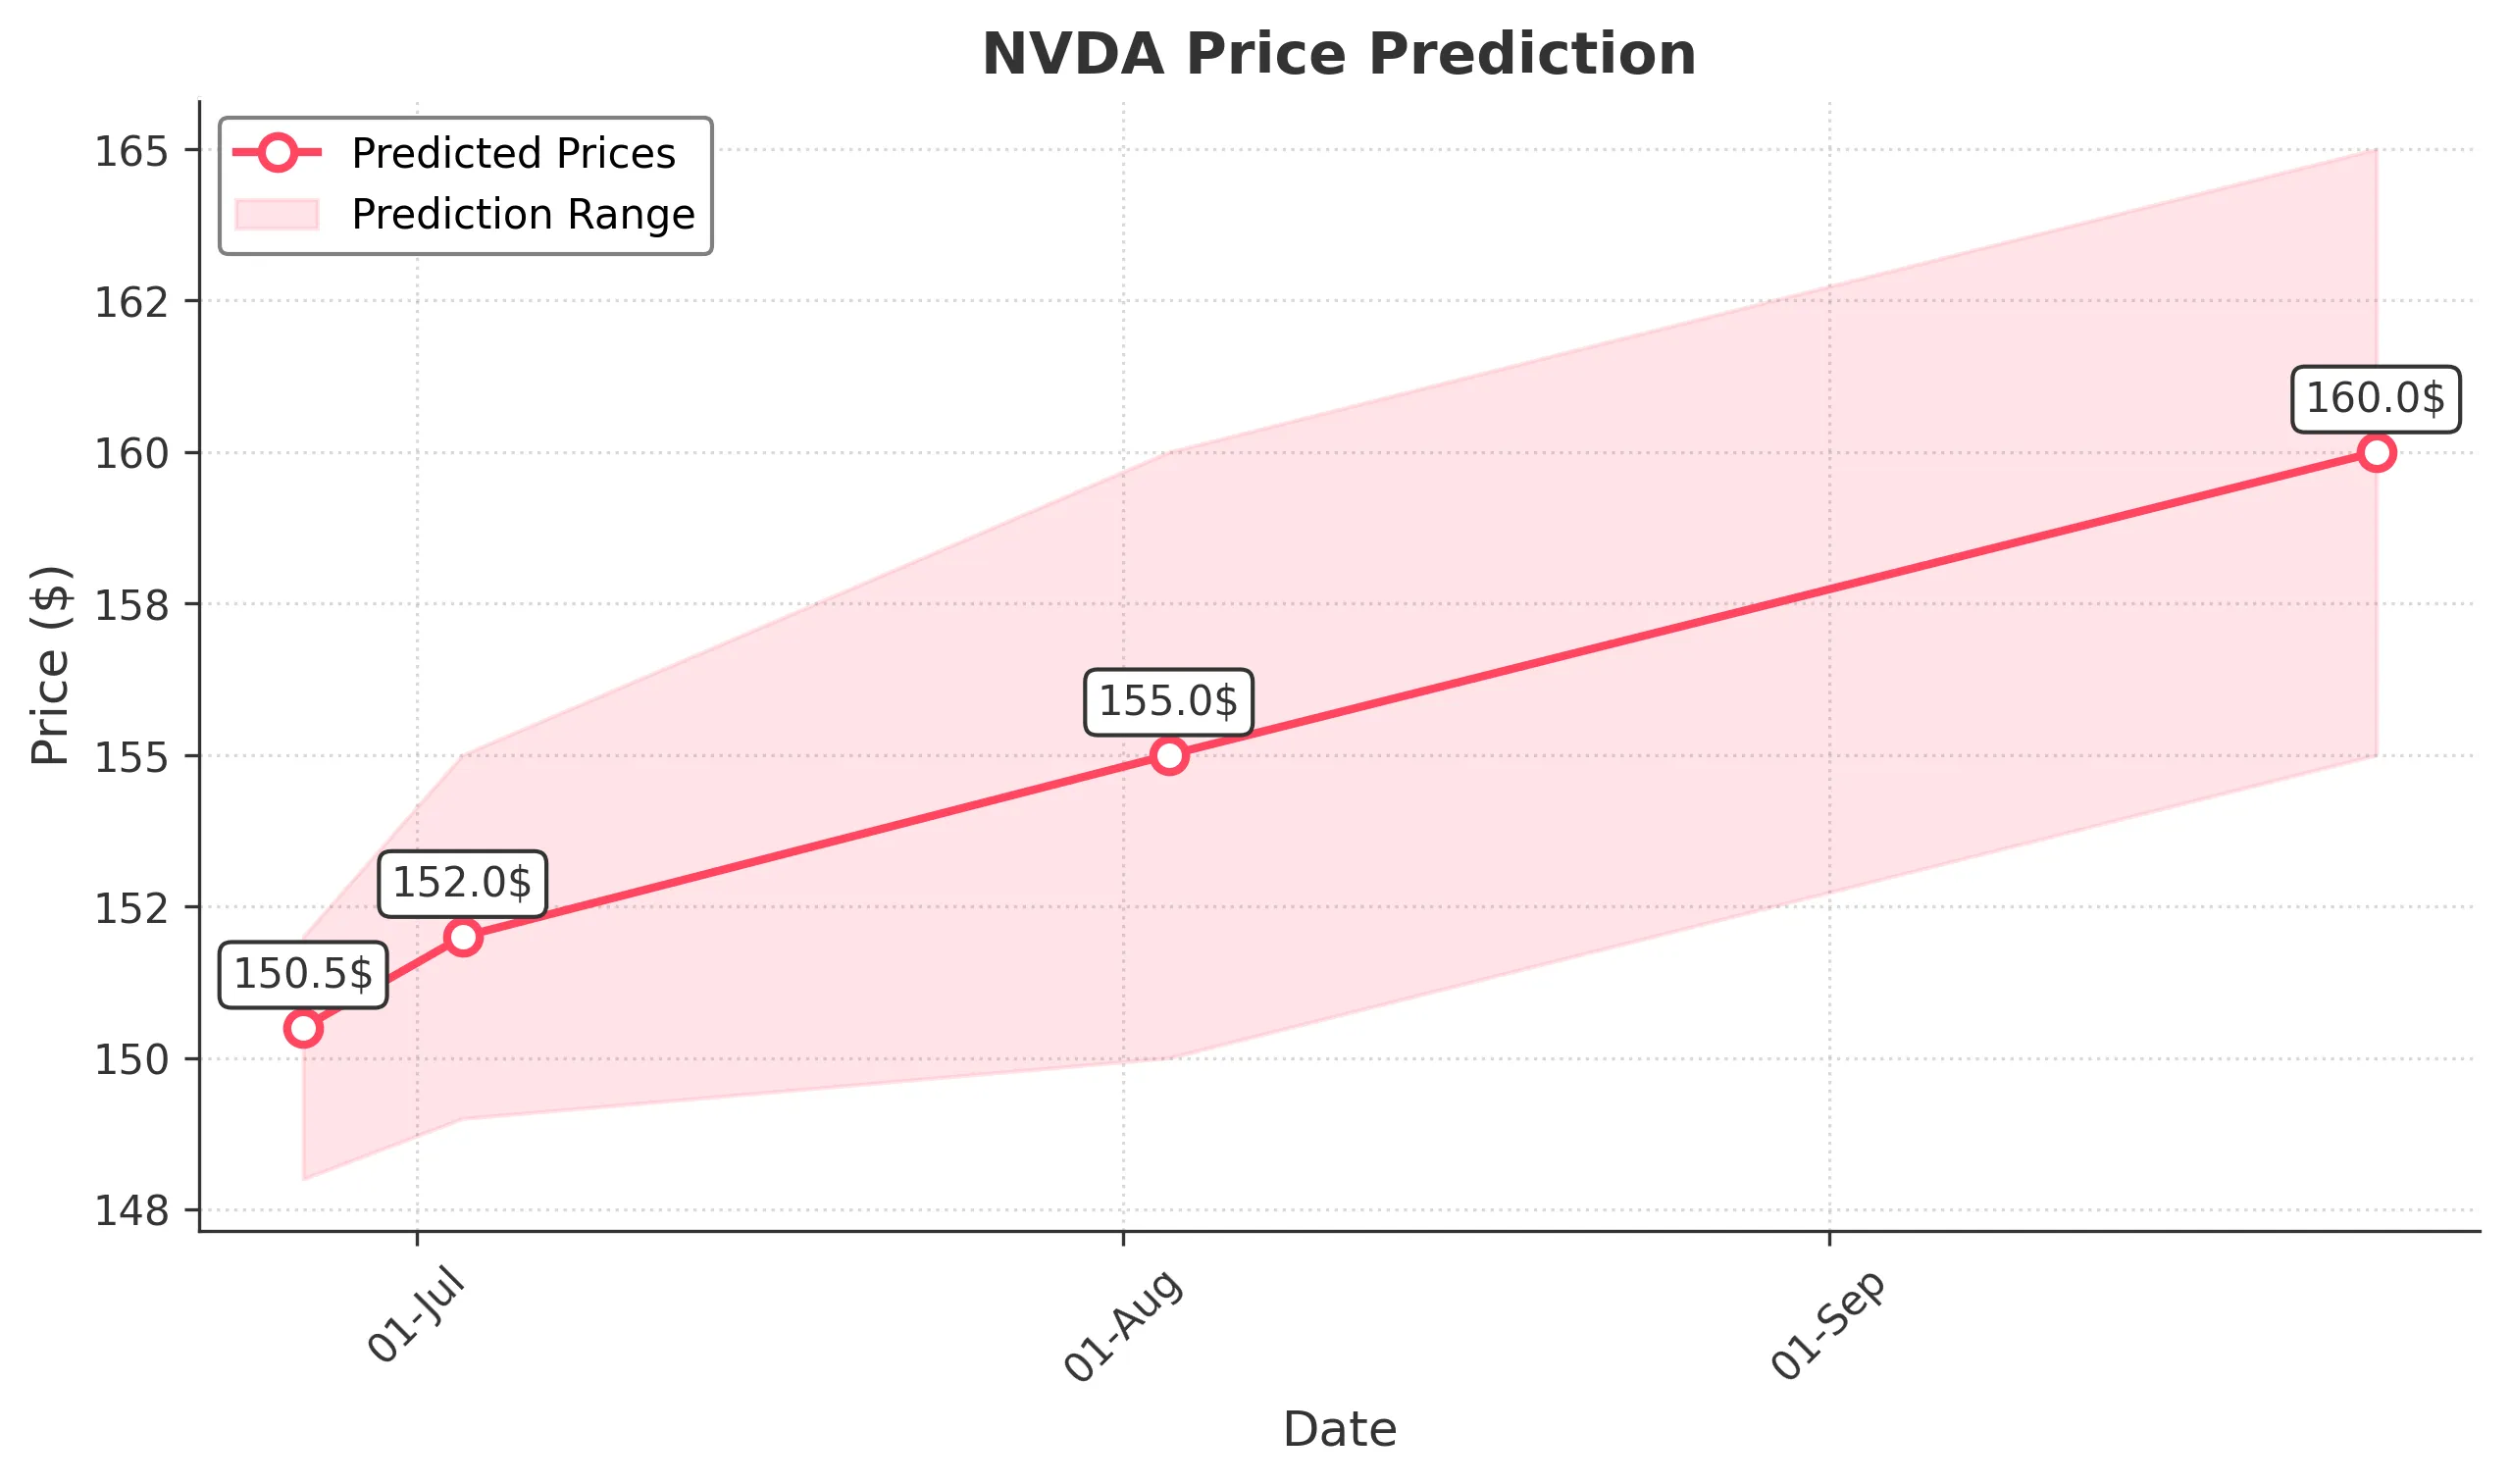
Target: June 26, 2025$150.5
$149.5
$152
$148
Description
The stock shows bullish momentum with a recent close at 150.063293. The RSI is approaching overbought levels, indicating potential for a pullback. However, strong buying volume suggests continued upward pressure. Watch for resistance at 152.
Analysis
Over the past 3 months, NVDA has shown a bullish trend with significant support at 145 and resistance at 152. The recent price action indicates strong buying interest, but the RSI nearing overbought levels raises concerns for a short-term correction.
Confidence Level
Potential Risks
Potential for a pullback due to overbought RSI and market volatility.
1 Week Prediction
Target: July 3, 2025$152
$150.5
$155
$149
Description
The bullish trend is expected to continue into next week, with strong support at 150. The MACD shows a bullish crossover, and the volume remains robust. However, watch for potential resistance at 155.
Analysis
NVDA has maintained a bullish trend with key support at 150 and resistance at 155. The MACD and moving averages indicate upward momentum, but external factors could introduce volatility.
Confidence Level
Potential Risks
Market sentiment could shift due to macroeconomic news, impacting the bullish outlook.
1 Month Prediction
Target: August 3, 2025$155
$152
$160
$150
Description
Expect continued bullish momentum with a target close of 155. The Fibonacci retracement levels support this upward movement, but watch for potential resistance at 160. Volume trends remain strong.
Analysis
The stock has shown a strong upward trend, with significant support at 150 and resistance at 160. The technical indicators suggest continued bullish momentum, but external factors could introduce volatility.
Confidence Level
Potential Risks
Market corrections or negative news could impact the bullish trend.
3 Months Prediction
Target: September 25, 2025$160
$157
$165
$155
Description
Long-term bullish outlook with a target close of 160. The stock is expected to break through resistance levels, supported by strong fundamentals and market sentiment. However, watch for potential corrections.
Analysis
Over the past 3 months, NVDA has shown a strong bullish trend with key support at 150 and resistance at 160. The overall market sentiment is positive, but external factors could introduce volatility.
Confidence Level
Potential Risks
Unforeseen macroeconomic events could lead to volatility and impact the prediction.