NVDA Trading Predictions
1 Day Prediction
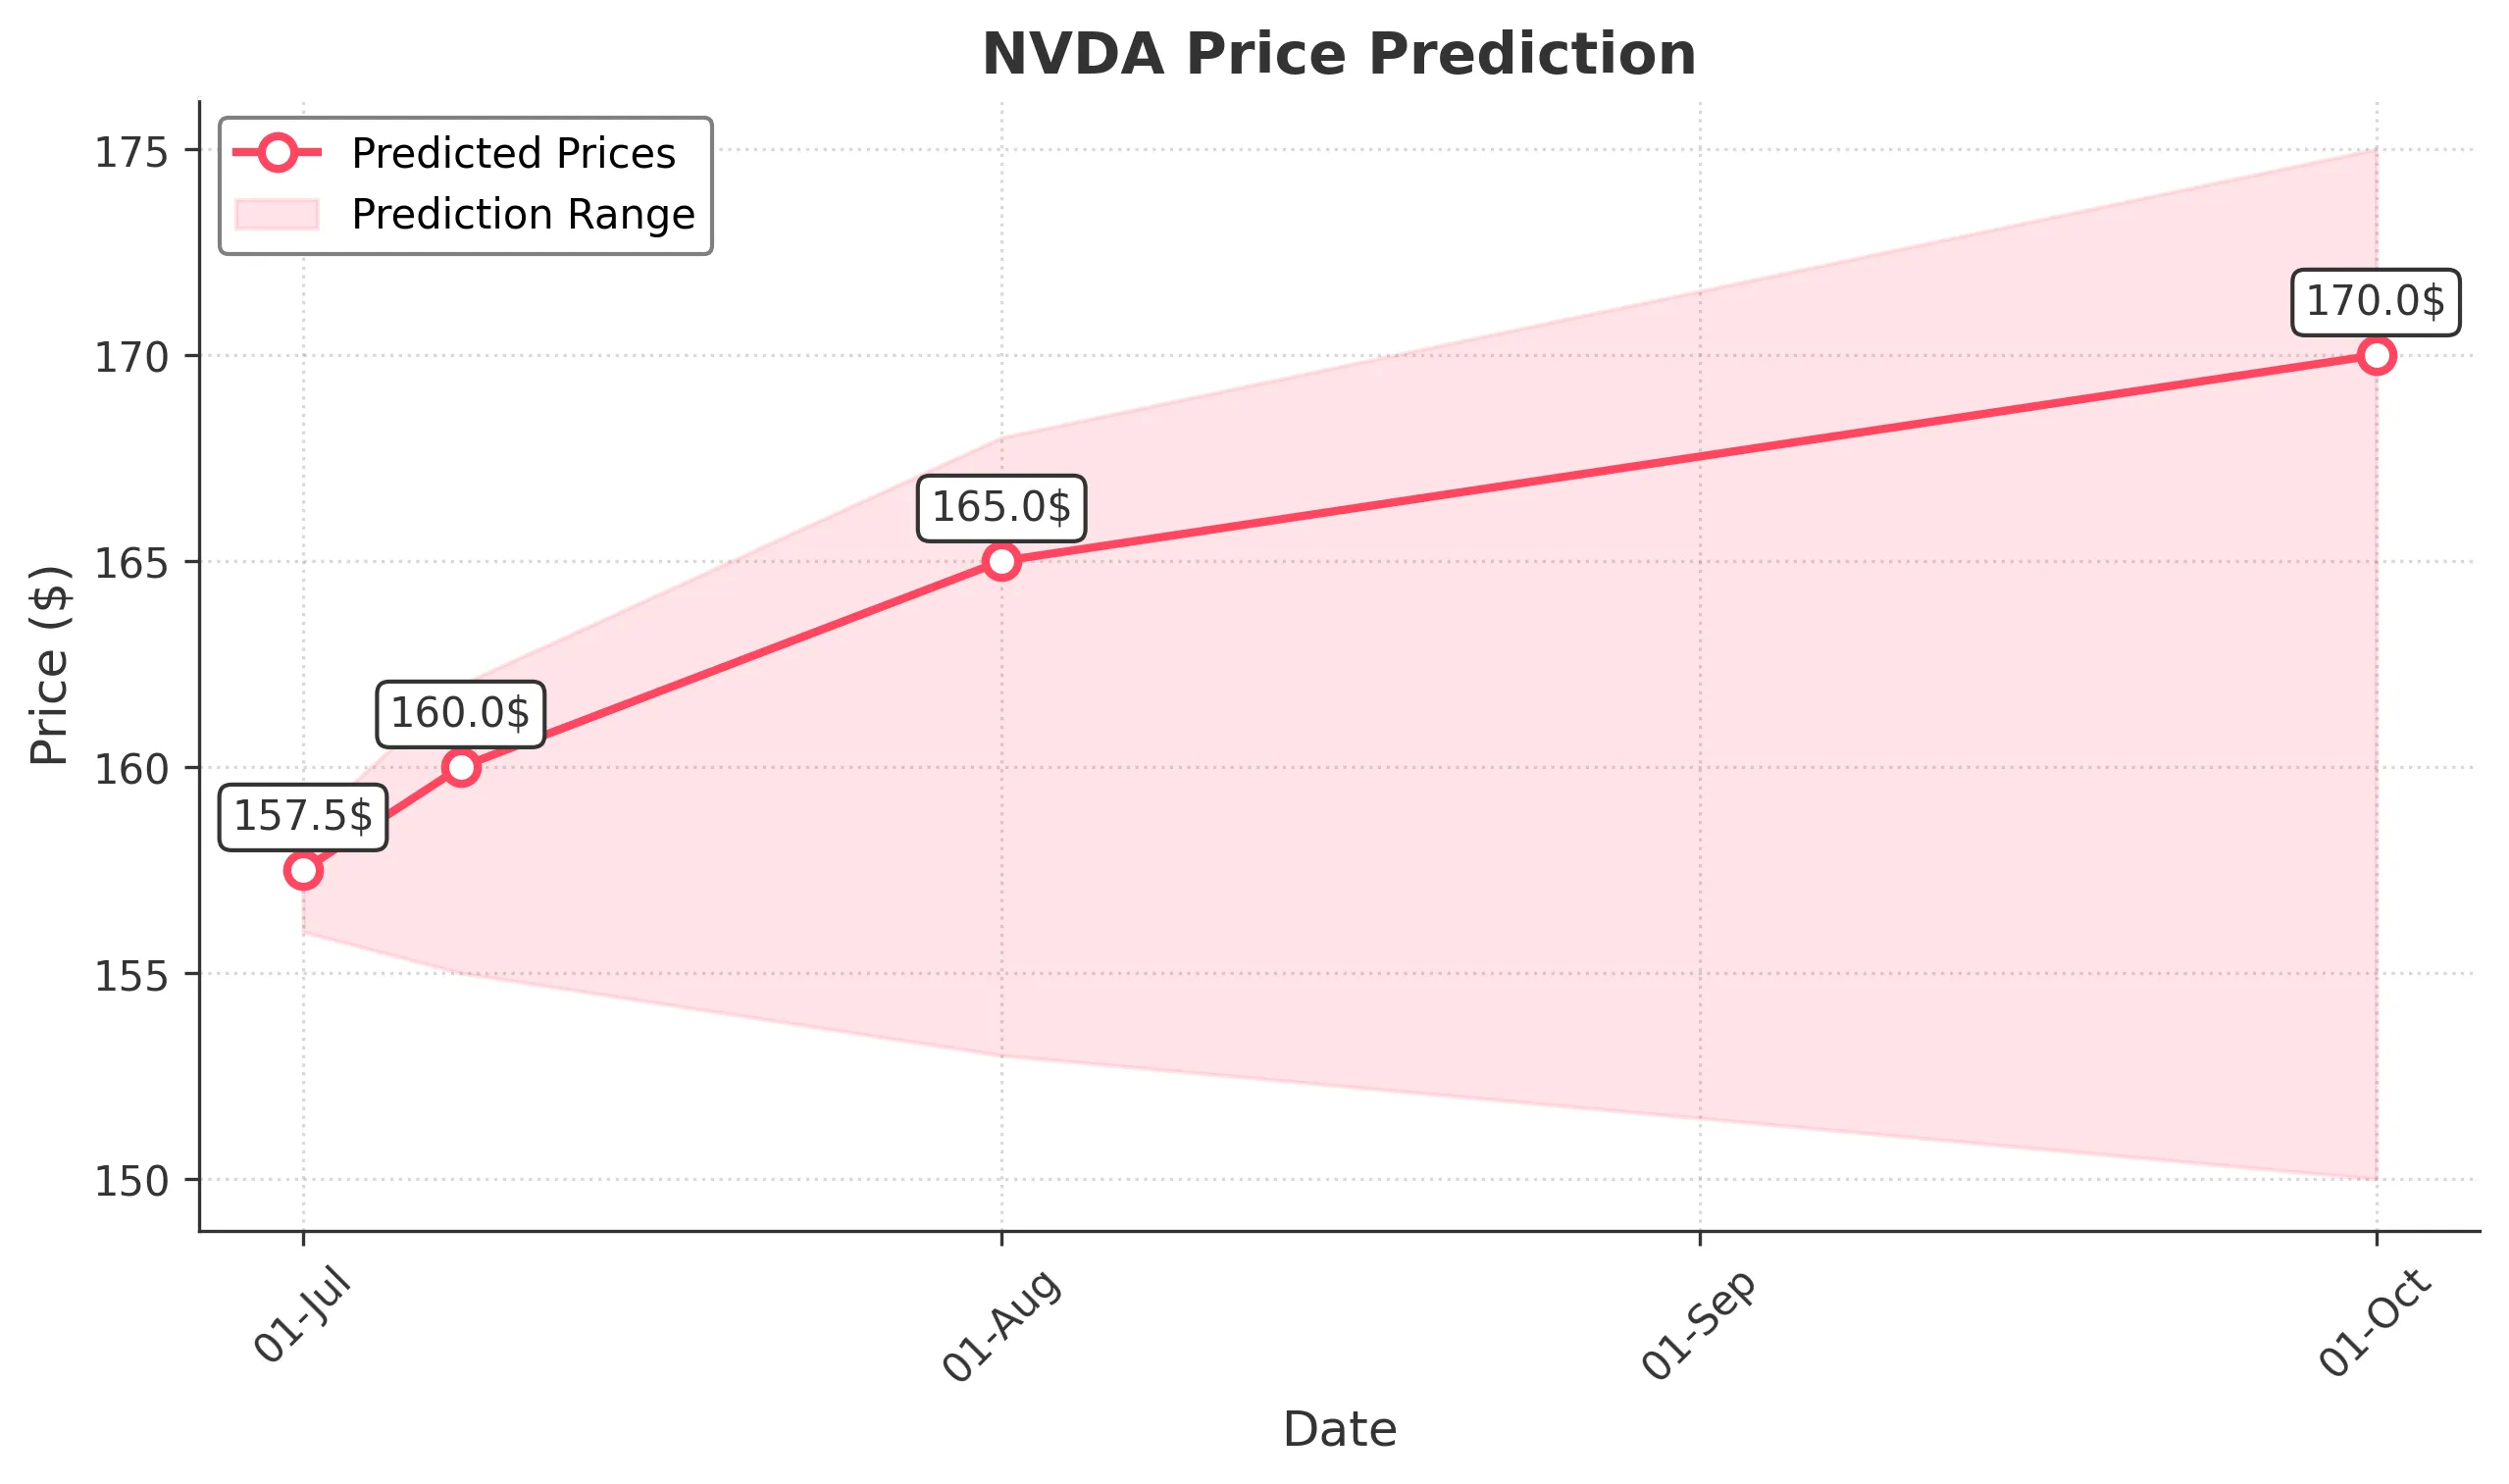
Target: July 1, 2025$157.5
$157
$158.5
$156
Description
The stock shows bullish momentum with a recent upward trend. The RSI is approaching overbought levels, indicating potential for a pullback. However, strong support at $156 and resistance at $158 suggest a tight range for tomorrow.
Analysis
Over the past 3 months, NVDA has shown a bullish trend, with significant support at $156 and resistance at $158. The recent volume spikes indicate strong buying interest. Technical indicators like MACD and moving averages support upward momentum, but RSI suggests caution.
Confidence Level
Potential Risks
Potential market volatility could impact the prediction, especially if external news affects sentiment.
1 Week Prediction
Target: July 8, 2025$160
$158
$162
$155
Description
The stock is expected to continue its upward trajectory, supported by bullish sentiment and strong volume. However, the RSI indicates potential overbought conditions, which could lead to a correction. Watch for resistance at $162.
Analysis
NVDA has maintained a bullish trend with increasing volume. The MACD is positive, and moving averages indicate upward momentum. However, the RSI nearing overbought levels suggests caution. Key resistance at $162 may limit further gains.
Confidence Level
Potential Risks
Market corrections or negative news could reverse the trend, impacting the accuracy of this prediction.
1 Month Prediction
Target: August 1, 2025$165
$160
$168
$153
Description
Expect continued bullish momentum driven by strong earnings and market sentiment. However, the potential for profit-taking exists as the stock approaches resistance levels. Watch for volatility around earnings announcements.
Analysis
The stock has shown a strong upward trend, with significant support at $153. Technical indicators suggest continued bullish momentum, but the RSI indicates potential overbought conditions. Volume patterns show strong buying interest, but external factors could introduce volatility.
Confidence Level
Potential Risks
Earnings reports and macroeconomic factors could lead to unexpected volatility, affecting the stock's performance.
3 Months Prediction
Target: October 1, 2025$170
$165
$175
$150
Description
Long-term bullish outlook supported by strong fundamentals and market trends. However, potential economic downturns or sector-specific issues could pose risks. Watch for key support at $150.
Analysis
Over the past 3 months, NVDA has shown a strong bullish trend, with key support at $150. Technical indicators suggest continued upward momentum, but external economic factors could introduce volatility. The stock's performance will depend on broader market conditions and sector trends.
Confidence Level
Potential Risks
Macroeconomic conditions and sector performance could significantly impact the stock's trajectory, introducing uncertainty.