NVDA Trading Predictions
1 Day Prediction
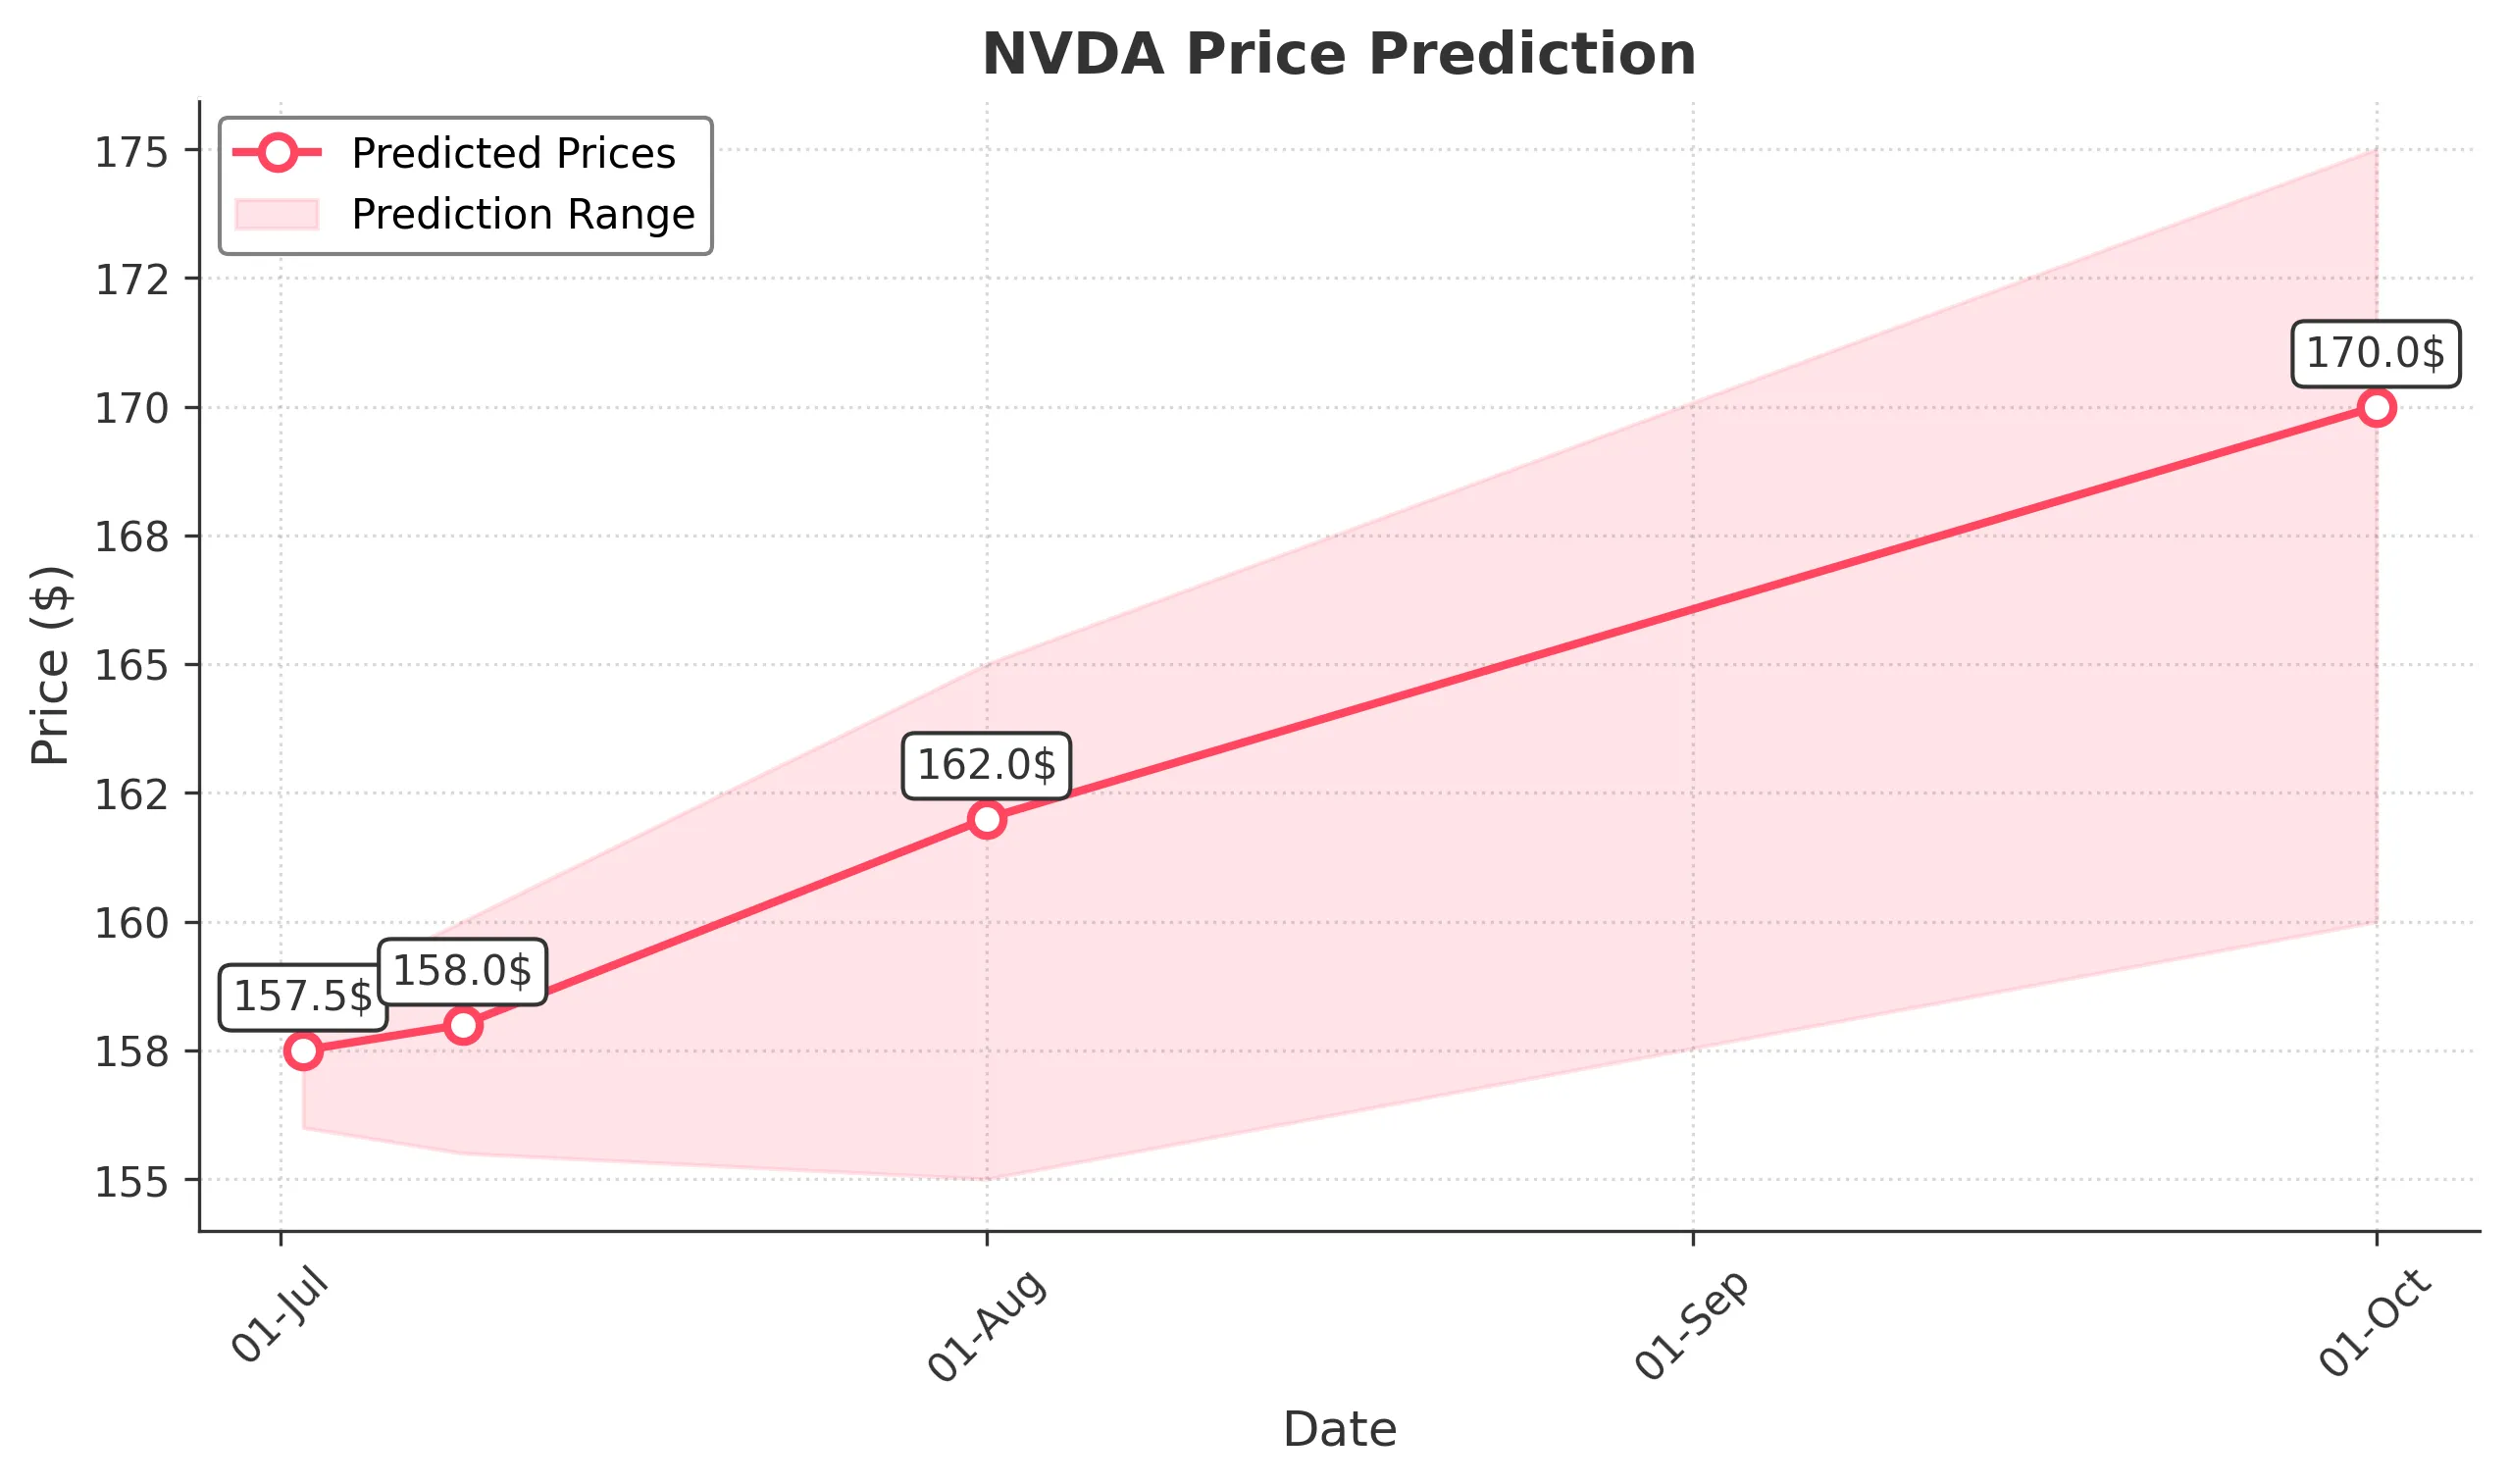
Target: July 2, 2025$157.5
$157
$158.5
$156
Description
The stock shows a bullish trend with a recent upward movement. The RSI is approaching overbought levels, indicating potential for a pullback. However, strong support at 156.00 suggests limited downside risk.
Analysis
Over the past 3 months, NVDA has shown a bullish trend, with significant support at 156.00 and resistance around 158.00. The MACD indicates upward momentum, while volume spikes suggest strong buying interest.
Confidence Level
Potential Risks
Potential market volatility and profit-taking could impact the price.
1 Week Prediction
Target: July 9, 2025$158
$157.5
$160
$155.5
Description
The stock is expected to maintain its upward trajectory, supported by recent bullish candlestick patterns. However, the RSI indicates overbought conditions, which may lead to a short-term correction.
Analysis
NVDA has been on a strong upward trend, with key resistance at 160.00. The recent price action shows bullish engulfing patterns, and the ATR indicates increasing volatility, suggesting potential for price swings.
Confidence Level
Potential Risks
Market sentiment could shift due to macroeconomic news, affecting the stock's performance.
1 Month Prediction
Target: August 1, 2025$162
$158.5
$165
$155
Description
The stock is likely to continue its bullish trend, driven by strong earnings expectations. However, the market may experience corrections, especially if the RSI remains elevated.
Analysis
In the last three months, NVDA has shown a clear bullish trend with significant support at 155.00. The MACD remains positive, and the Bollinger Bands indicate potential for further upward movement, but caution is warranted.
Confidence Level
Potential Risks
Earnings reports and broader market conditions could introduce volatility.
3 Months Prediction
Target: October 1, 2025$170
$165
$175
$160
Description
Long-term bullish sentiment is supported by strong fundamentals and market demand. However, potential economic headwinds could impact growth.
Analysis
NVDA has shown resilience with a bullish trend over the past three months. Key resistance levels are at 175.00, while support is at 160.00. The stock's performance is influenced by broader market trends and economic indicators.
Confidence Level
Potential Risks
Unforeseen macroeconomic events or shifts in market sentiment could lead to volatility.