NVDA Trading Predictions
1 Day Prediction
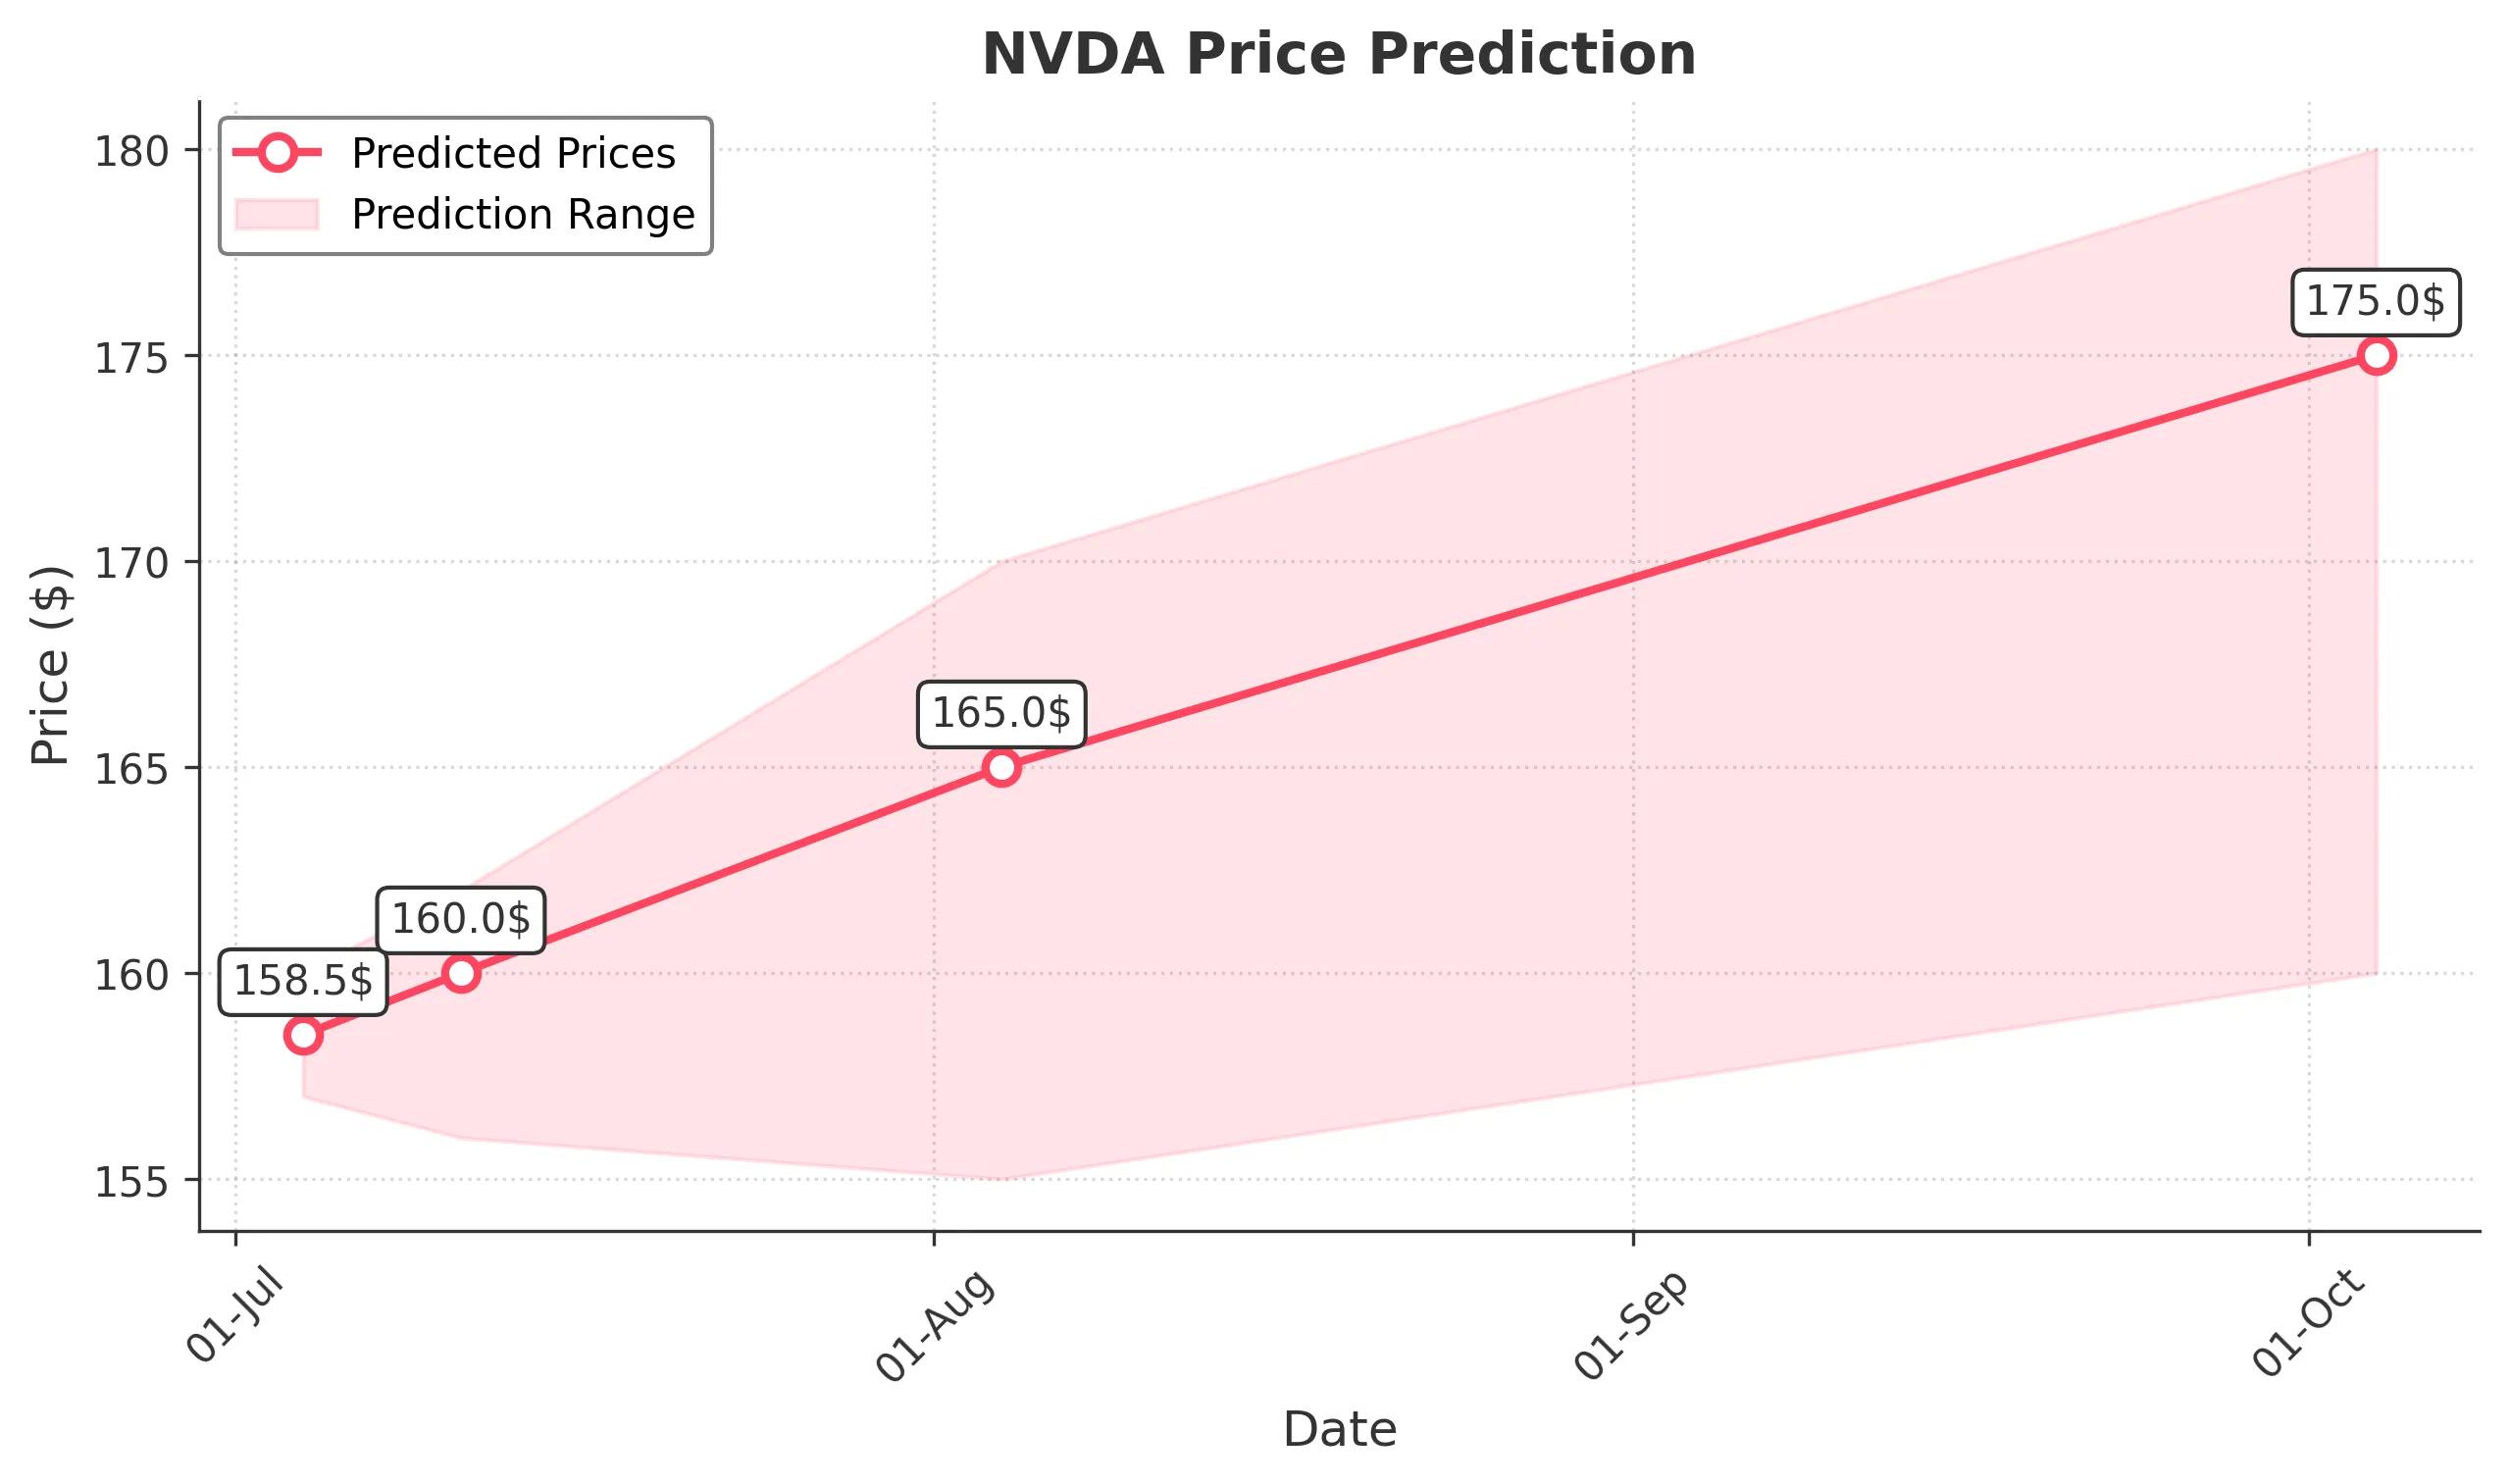
Target: July 4, 2025$158.5
$158
$160
$157
Description
The stock shows bullish momentum with a recent upward trend. The RSI is approaching overbought levels, indicating potential for a pullback. However, strong buying volume suggests continued interest. Watch for resistance at $160.
Analysis
Over the past 3 months, NVDA has shown a bullish trend, with significant support at $150 and resistance around $160. The MACD indicates upward momentum, while volume spikes on up days suggest strong buying interest. However, volatility remains a concern.
Confidence Level
Potential Risks
Potential for a pullback if RSI exceeds 70. Market sentiment may shift due to external news.
1 Week Prediction
Target: July 11, 2025$160
$158.5
$162
$156
Description
The stock is expected to continue its upward trajectory, supported by strong volume and bullish candlestick patterns. However, the RSI indicates overbought conditions, which could lead to a short-term correction.
Analysis
NVDA has maintained a bullish trend with key support at $150. The recent price action shows strong buying interest, but the RSI nearing overbought levels raises concerns about a potential pullback. Volume patterns indicate sustained interest.
Confidence Level
Potential Risks
Market volatility and potential profit-taking could impact the price. Watch for any negative news that may affect sentiment.
1 Month Prediction
Target: August 4, 2025$165
$160
$170
$155
Description
Expect continued bullish momentum as NVDA approaches key Fibonacci retracement levels. The MACD remains positive, indicating strength. However, watch for potential resistance at $170.
Analysis
The stock has shown a strong upward trend, with significant support at $150 and resistance at $170. The MACD and moving averages support bullish sentiment, but the RSI indicates potential overbought conditions. Volume trends suggest strong interest.
Confidence Level
Potential Risks
External market conditions and earnings reports could introduce volatility. A reversal pattern could emerge if the stock fails to break resistance.
3 Months Prediction
Target: October 4, 2025$175
$170
$180
$160
Description
Long-term bullish outlook as NVDA continues to capitalize on market trends. Key support at $160 and resistance at $180. Watch for earnings reports that could impact sentiment.
Analysis
Over the past 3 months, NVDA has shown a strong bullish trend, with key support at $150 and resistance at $180. The MACD and moving averages indicate strength, but external factors could introduce volatility. The stock's performance is closely tied to market sentiment.
Confidence Level
Potential Risks
Market conditions and macroeconomic factors could lead to volatility. A significant downturn in tech stocks could affect NVDA's performance.