NVDA Trading Predictions
1 Day Prediction
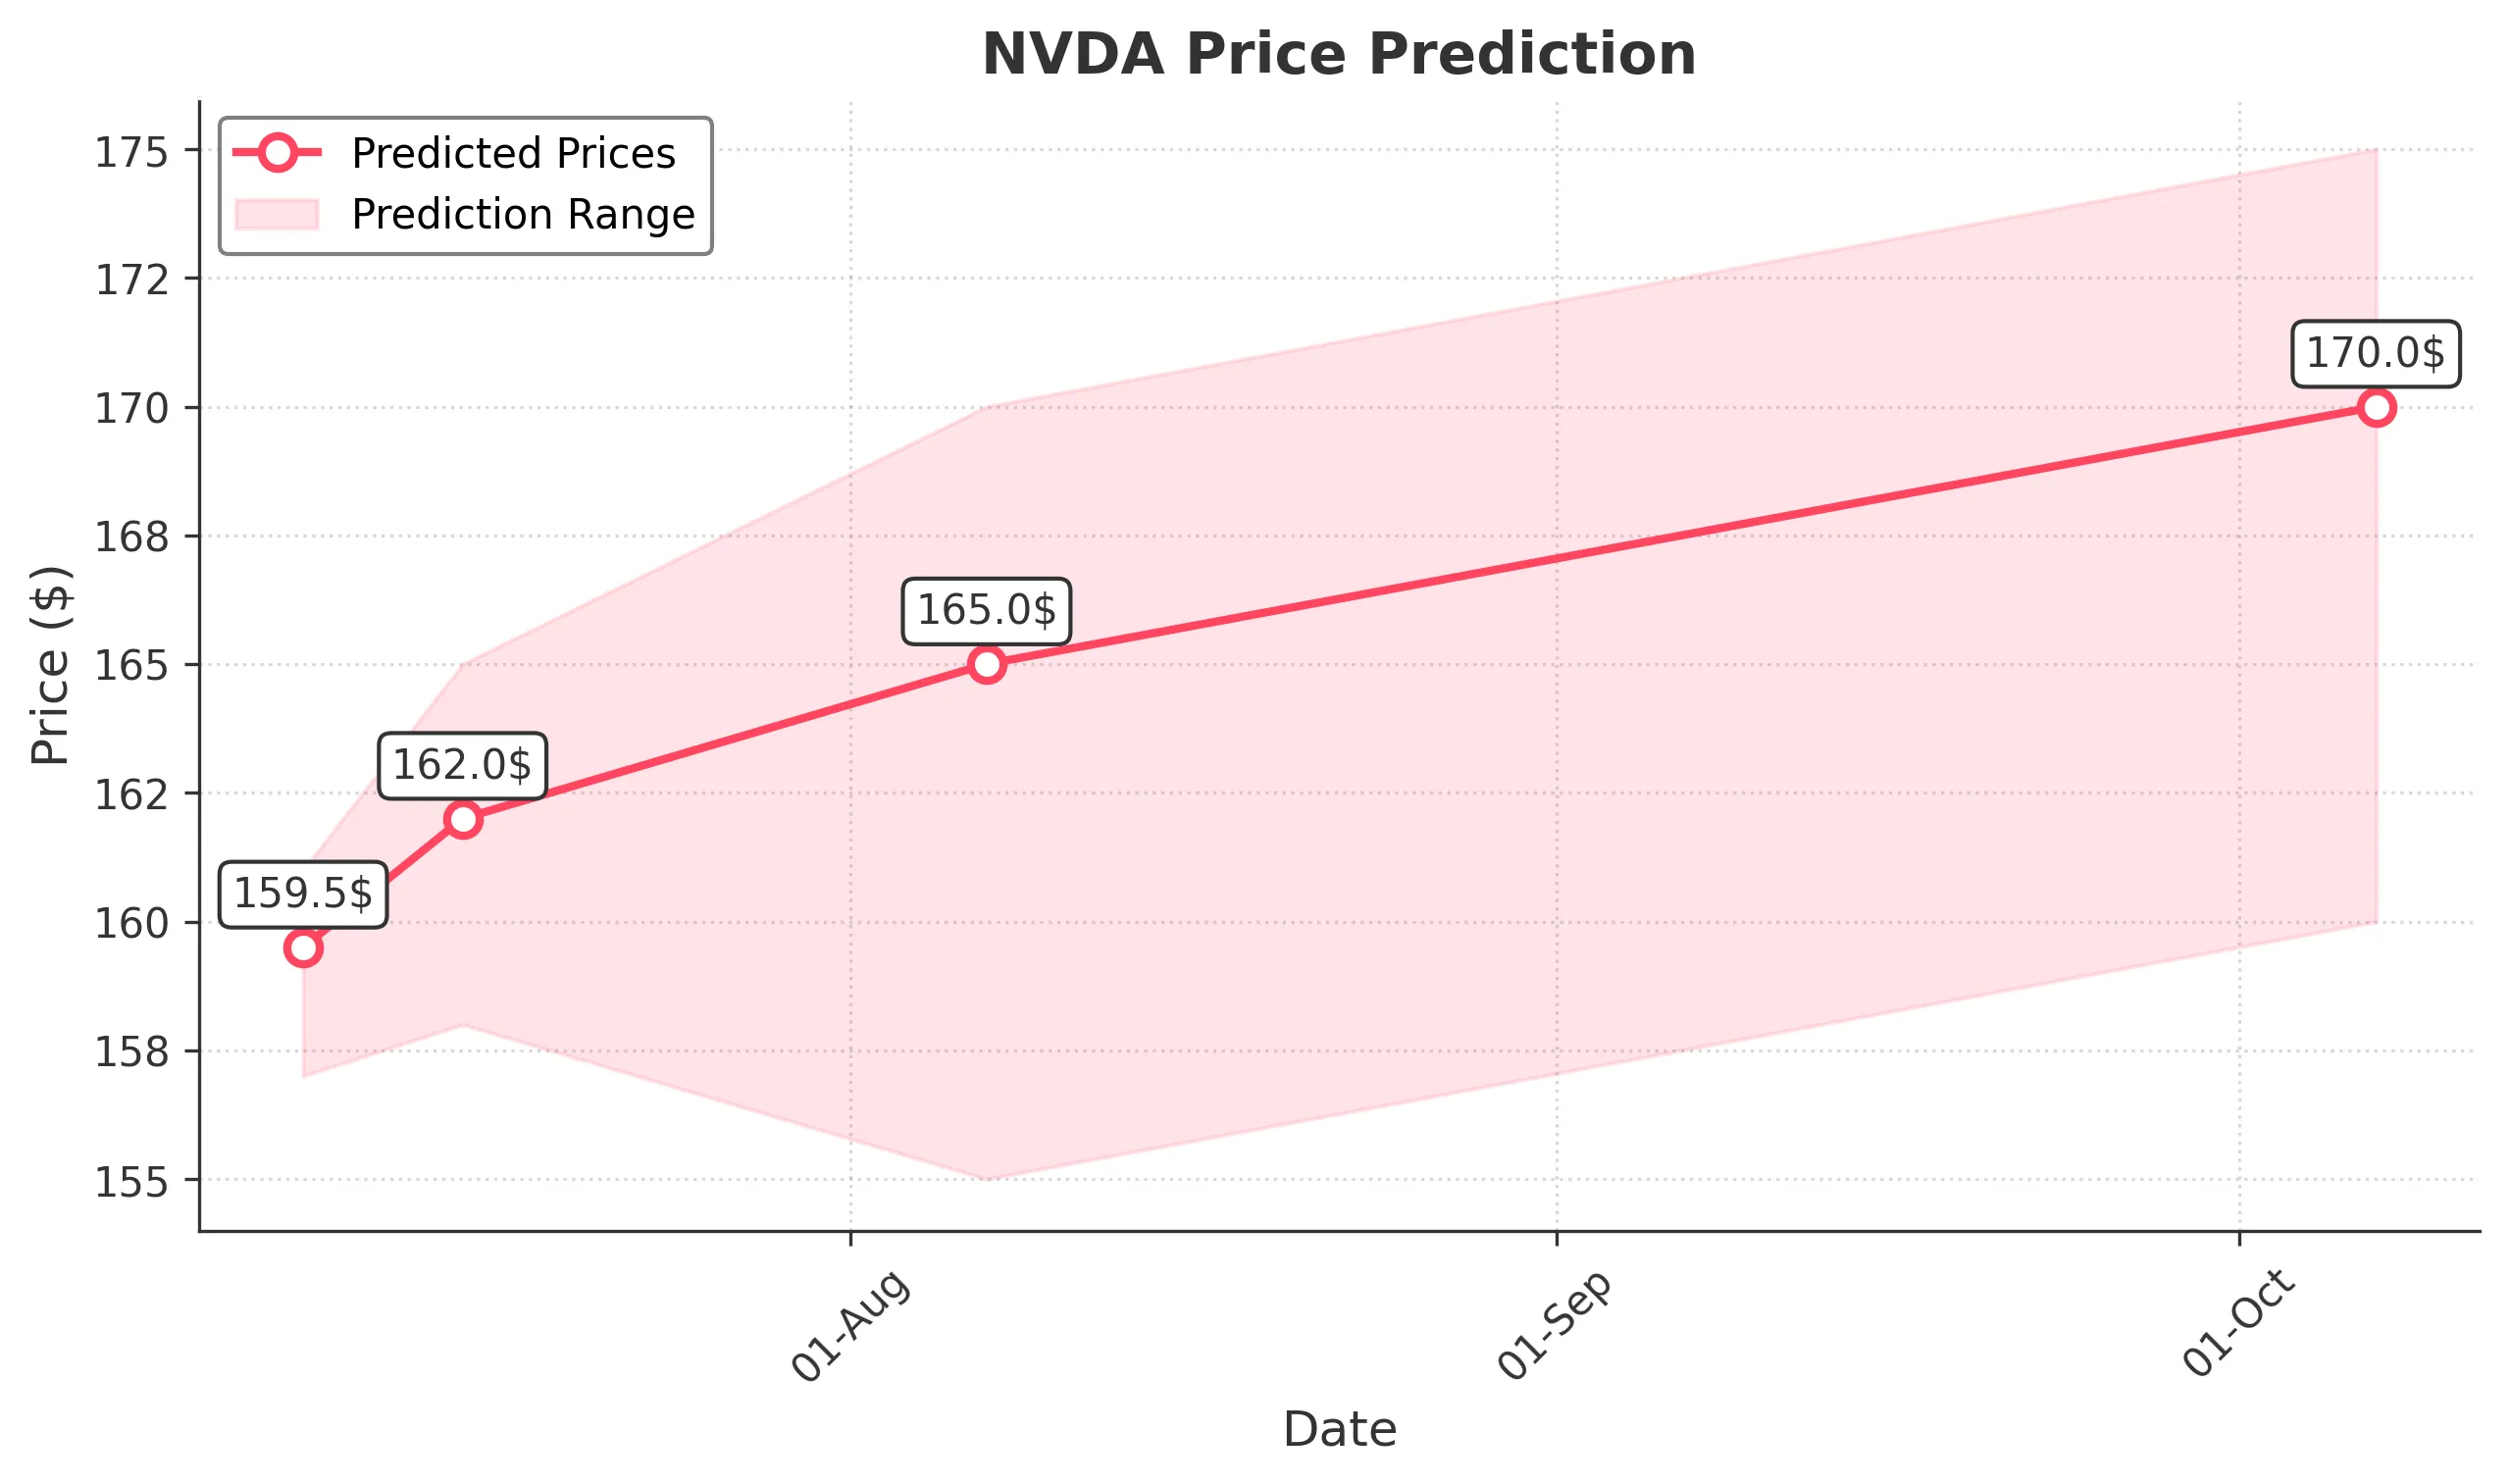
Target: July 8, 2025$159.5
$158.85
$161
$157
Description
The stock shows bullish momentum with a recent upward trend. The RSI is approaching overbought levels, indicating potential for a pullback. However, strong volume suggests continued interest. Watch for resistance at $161.
Analysis
Over the past 3 months, NVDA has shown a bullish trend, with significant support at $150 and resistance around $160. The MACD indicates upward momentum, while volume spikes suggest strong buying interest. However, the RSI nearing overbought levels raises caution.
Confidence Level
Potential Risks
Potential for a pullback if RSI exceeds 70. Market sentiment may shift due to external factors.
1 Week Prediction
Target: July 15, 2025$162
$159.5
$165
$158
Description
The stock is expected to continue its upward trajectory, supported by strong buying volume. The MACD remains bullish, and the price is likely to test the $165 resistance level. Watch for potential profit-taking.
Analysis
NVDA has maintained a bullish trend with key support at $150. The recent price action shows strong buying interest, but the RSI indicates potential overbought conditions. Volume patterns suggest sustained interest, but external market factors could introduce volatility.
Confidence Level
Potential Risks
Market volatility and profit-taking could lead to short-term corrections.
1 Month Prediction
Target: August 7, 2025$165
$162
$170
$155
Description
The stock is likely to maintain its bullish trend, with a target of $165. The MACD remains positive, and volume trends support upward movement. However, watch for potential resistance at $170.
Analysis
In the last three months, NVDA has shown a strong upward trend, with significant support at $150. The MACD and moving averages indicate bullish momentum, but the RSI suggests caution as it approaches overbought territory. External economic factors may influence future performance.
Confidence Level
Potential Risks
Economic indicators and earnings reports could impact market sentiment.
3 Months Prediction
Target: October 7, 2025$170
$165
$175
$160
Description
The stock is expected to reach $170, driven by strong fundamentals and market sentiment. However, potential resistance at $175 may lead to volatility. Monitor for any macroeconomic changes.
Analysis
NVDA has shown a consistent bullish trend, with key support at $150 and resistance at $170. The MACD and volume trends indicate strong buying interest, but the RSI suggests caution. Economic conditions and market sentiment will be crucial in the coming months.
Confidence Level
Potential Risks
Unforeseen market events or economic downturns could impact the stock's performance.