NVDA Trading Predictions
1 Day Prediction
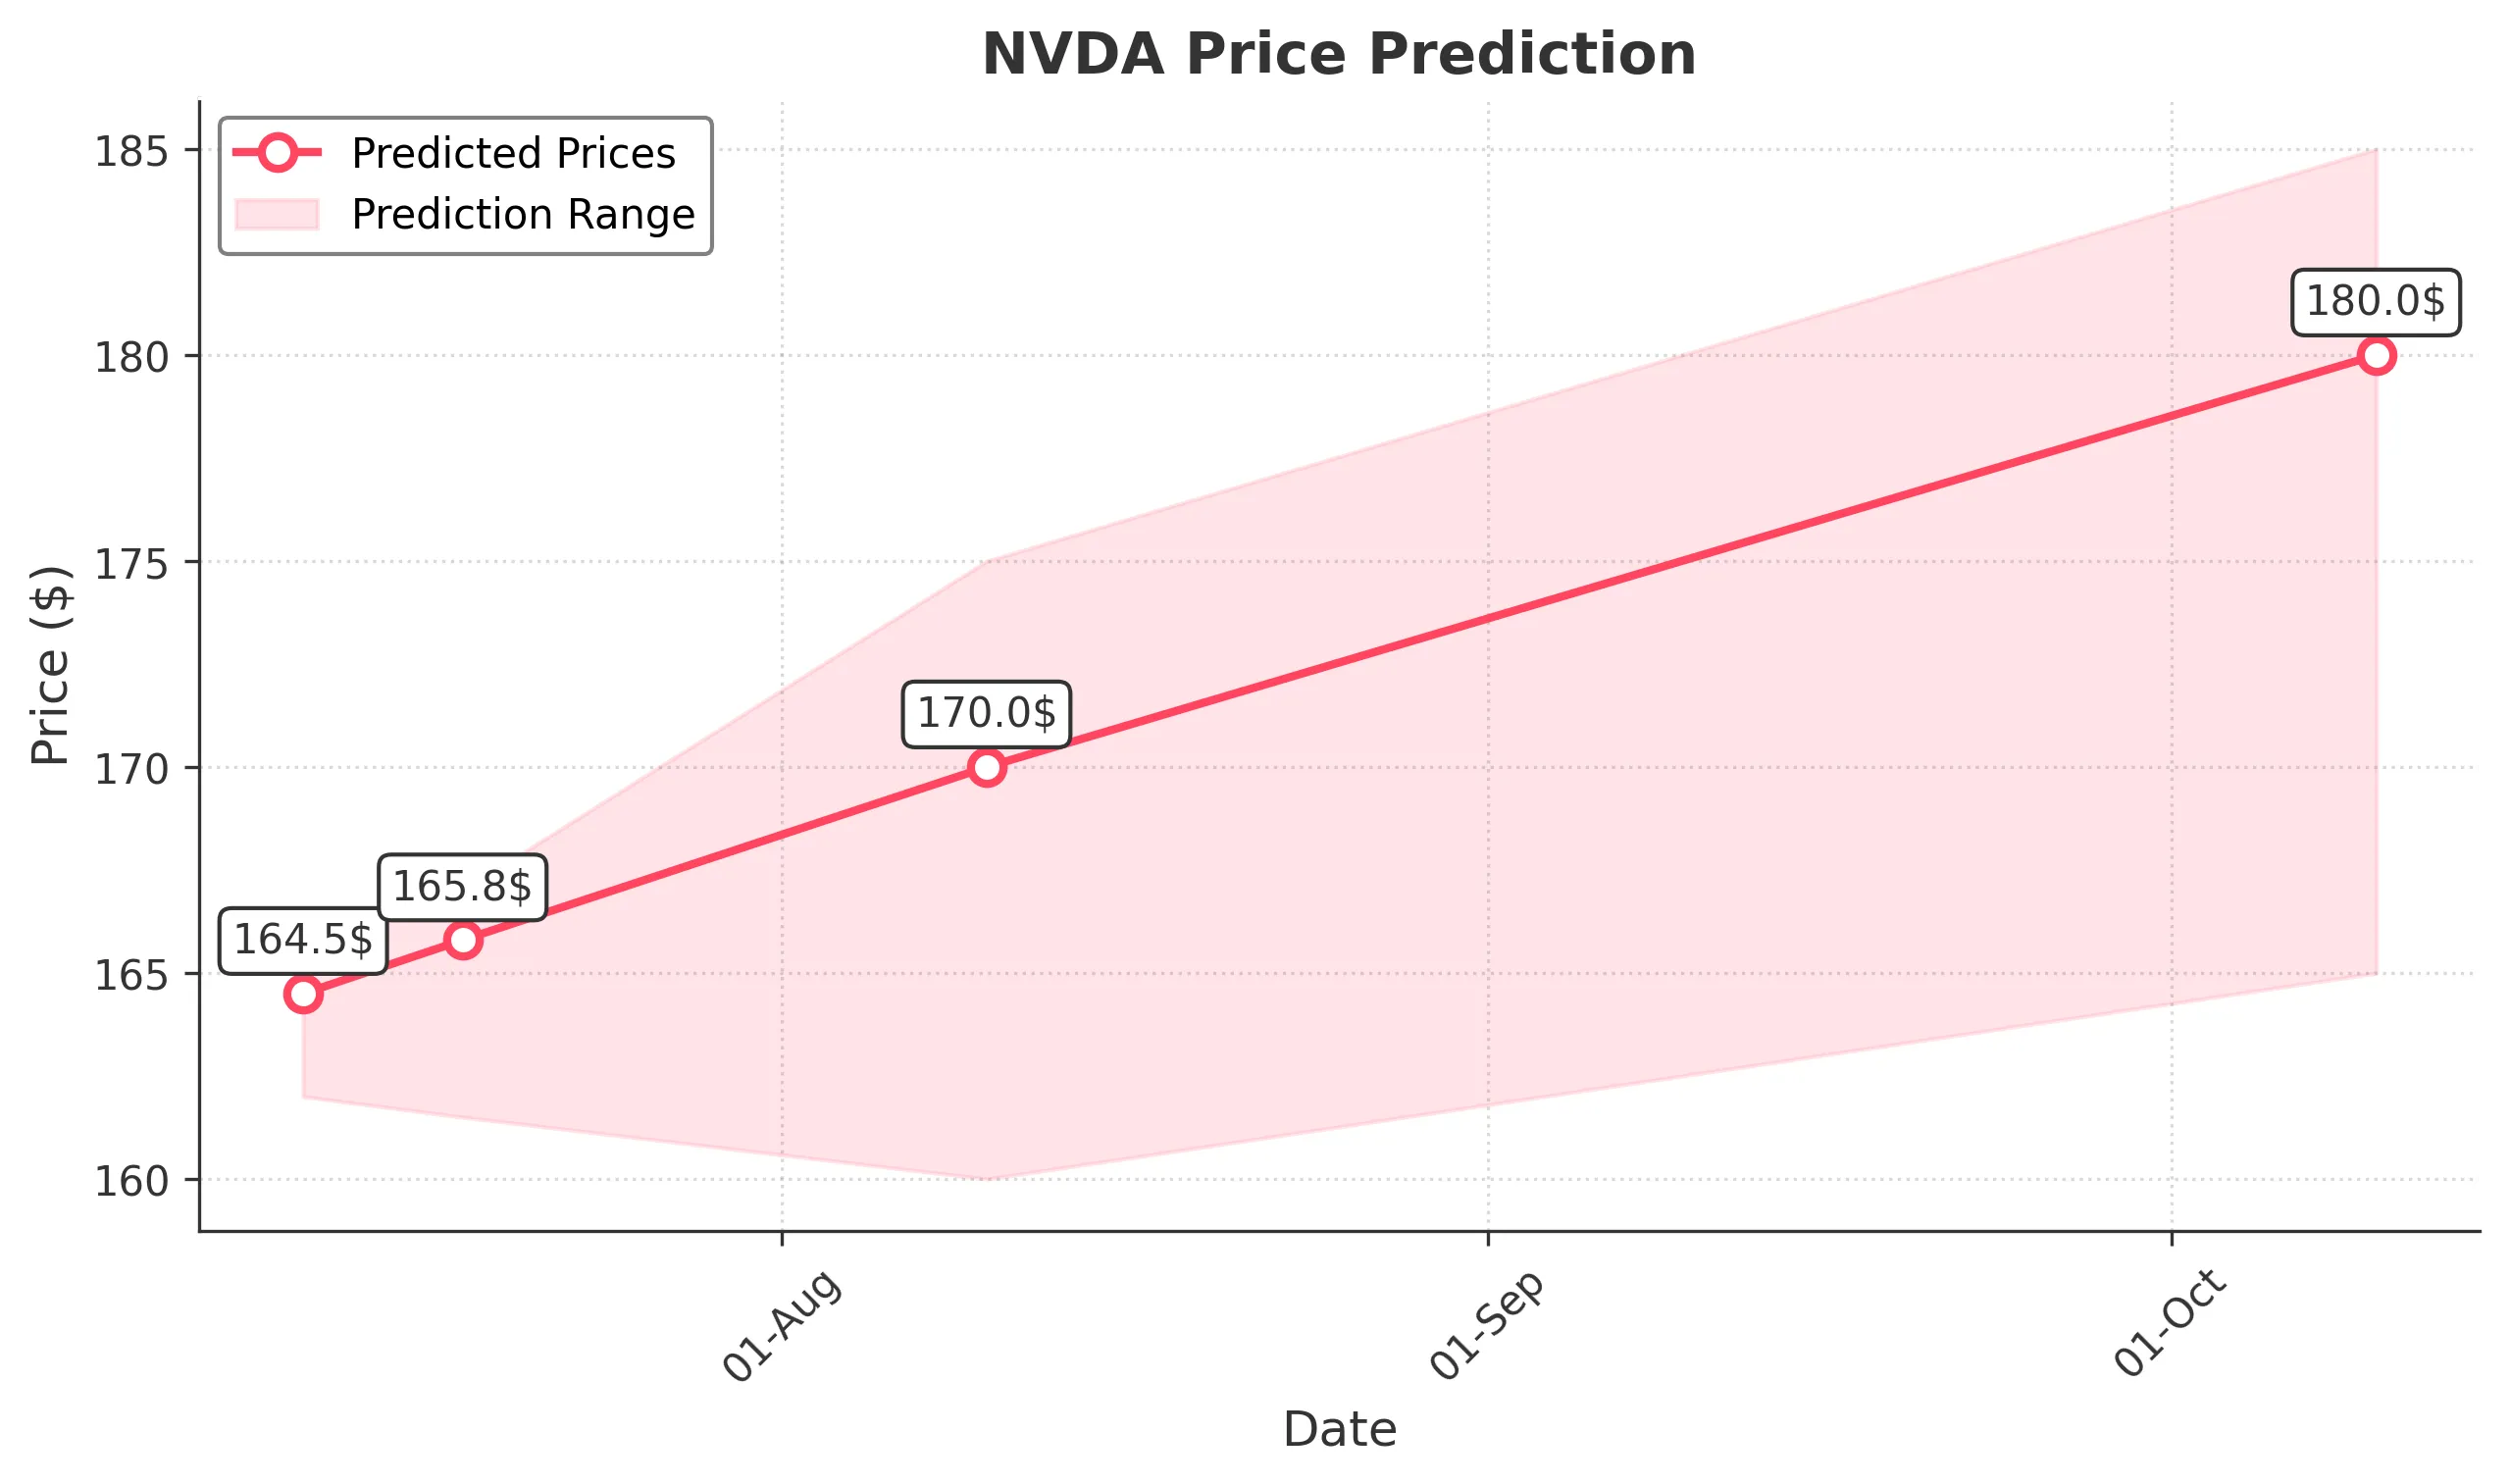
Target: July 11, 2025$164.5
$163.5
$165.5
$162
Description
The stock shows bullish momentum with a recent upward trend. The MACD is positive, and RSI is approaching overbought levels, indicating potential for a slight pullback. However, strong buying volume suggests continued upward pressure.
Analysis
Over the past 3 months, NVDA has shown a bullish trend, with significant support at $150 and resistance around $165. The recent price action indicates strong buying interest, but RSI nearing overbought levels suggests caution.
Confidence Level
Potential Risks
Potential market volatility and profit-taking could lead to a reversal.
1 Week Prediction
Target: July 18, 2025$165.8
$164.5
$167
$161.5
Description
The upward trend is expected to continue, supported by bullish candlestick patterns and strong volume. However, the RSI indicates overbought conditions, which may lead to a short-term pullback before further gains.
Analysis
NVDA has maintained a bullish trend with key support at $160. The MACD remains positive, and volume spikes indicate strong interest. However, the stock is approaching resistance levels, which could trigger profit-taking.
Confidence Level
Potential Risks
Market sentiment could shift due to macroeconomic news or earnings reports.
1 Month Prediction
Target: August 10, 2025$170
$165.5
$175
$160
Description
The stock is expected to reach new highs as bullish momentum persists. The Fibonacci retracement levels suggest a target around $170, but caution is warranted as the RSI indicates potential overbought conditions.
Analysis
In the last 3 months, NVDA has shown strong upward momentum, with significant resistance at $175. The MACD and moving averages support continued growth, but overbought signals may lead to volatility.
Confidence Level
Potential Risks
External factors such as earnings reports or economic data could impact performance.
3 Months Prediction
Target: October 10, 2025$180
$170
$185
$165
Description
Long-term bullish sentiment is expected to drive prices higher, supported by strong fundamentals and market demand. However, potential market corrections and economic uncertainties could introduce volatility.
Analysis
NVDA has shown a strong bullish trend, with key support at $160 and resistance at $185. The stock's performance is influenced by broader market trends and technological advancements, but caution is advised due to potential market corrections.
Confidence Level
Potential Risks
Unforeseen macroeconomic events or shifts in market sentiment could lead to price corrections.