NVDA Trading Predictions
1 Day Prediction
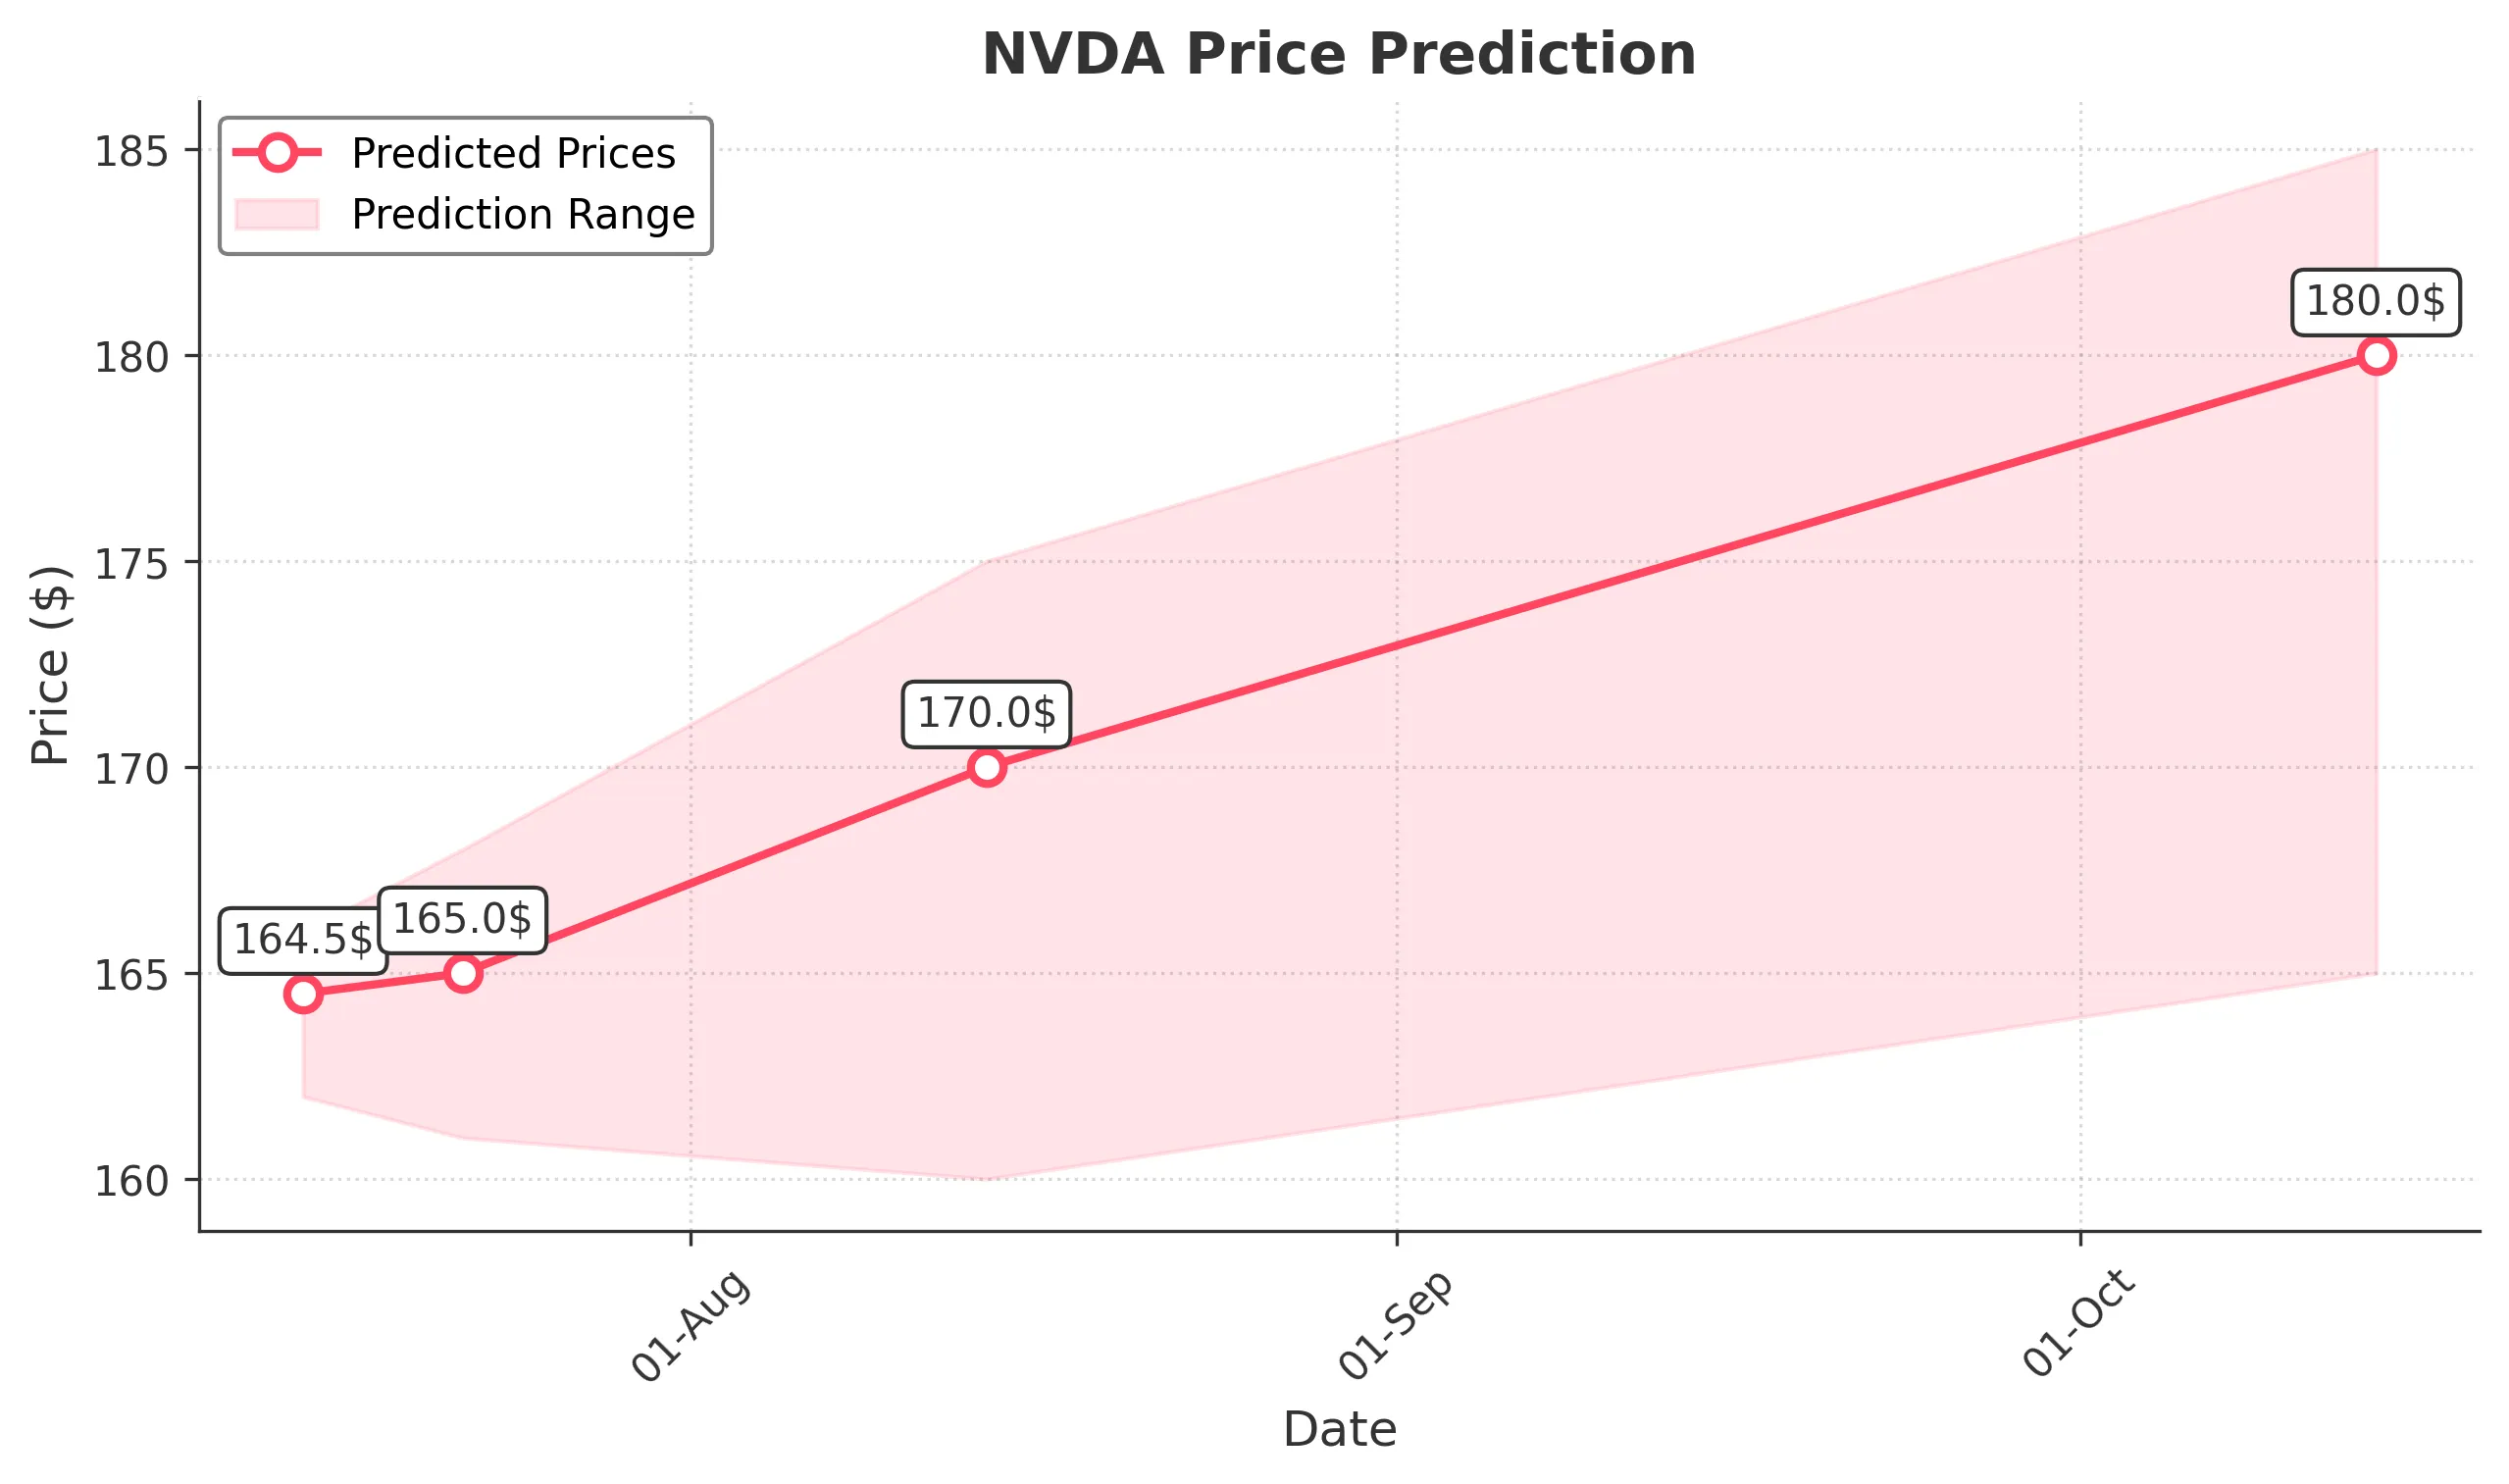
Target: July 15, 2025$164.5
$164
$166
$162
Description
The stock shows a bullish trend with a recent upward movement. The RSI is approaching overbought levels, indicating potential short-term consolidation. A Doji pattern suggests indecision, but overall momentum remains positive.
Analysis
Over the past 3 months, NVDA has shown a bullish trend with significant upward momentum. Key support is around $160, while resistance is near $167. Volume has been strong, indicating investor interest. However, the RSI suggests caution as it nears overbought territory.
Confidence Level
Potential Risks
Potential for a pullback if market sentiment shifts or if profit-taking occurs.
1 Week Prediction
Target: July 22, 2025$165
$164.5
$168
$161
Description
The stock is expected to maintain its bullish trend, supported by strong volume and positive market sentiment. However, the MACD shows signs of potential divergence, indicating a possible slowdown in momentum.
Analysis
NVDA has been on a strong upward trajectory, with key resistance at $168. The recent candlestick patterns indicate bullish sentiment, but the MACD divergence raises concerns about sustainability. Volume remains robust, suggesting continued interest.
Confidence Level
Potential Risks
Market volatility and external economic factors could impact performance.
1 Month Prediction
Target: August 14, 2025$170
$165.5
$175
$160
Description
Expect continued bullish momentum as NVDA approaches key Fibonacci retracement levels. However, the RSI indicates potential overbought conditions, suggesting a correction could occur if momentum wanes.
Analysis
The stock has shown strong performance, with significant support at $160 and resistance at $175. The bullish trend is supported by strong volume, but the RSI indicates caution. Market sentiment remains positive, but external factors could influence price action.
Confidence Level
Potential Risks
Economic data releases and earnings reports could introduce volatility.
3 Months Prediction
Target: October 14, 2025$180
$170
$185
$165
Description
Long-term bullish outlook as NVDA continues to capitalize on market trends. However, potential resistance at $185 may lead to profit-taking. Watch for macroeconomic indicators that could impact tech stocks.
Analysis
Over the past three months, NVDA has shown a strong upward trend, with key support at $165 and resistance at $185. The stock's performance is influenced by broader market trends and tech sector dynamics. While bullish, external factors could introduce risks.
Confidence Level
Potential Risks
Market corrections and economic shifts could lead to volatility.