NVDA Trading Predictions
1 Day Prediction
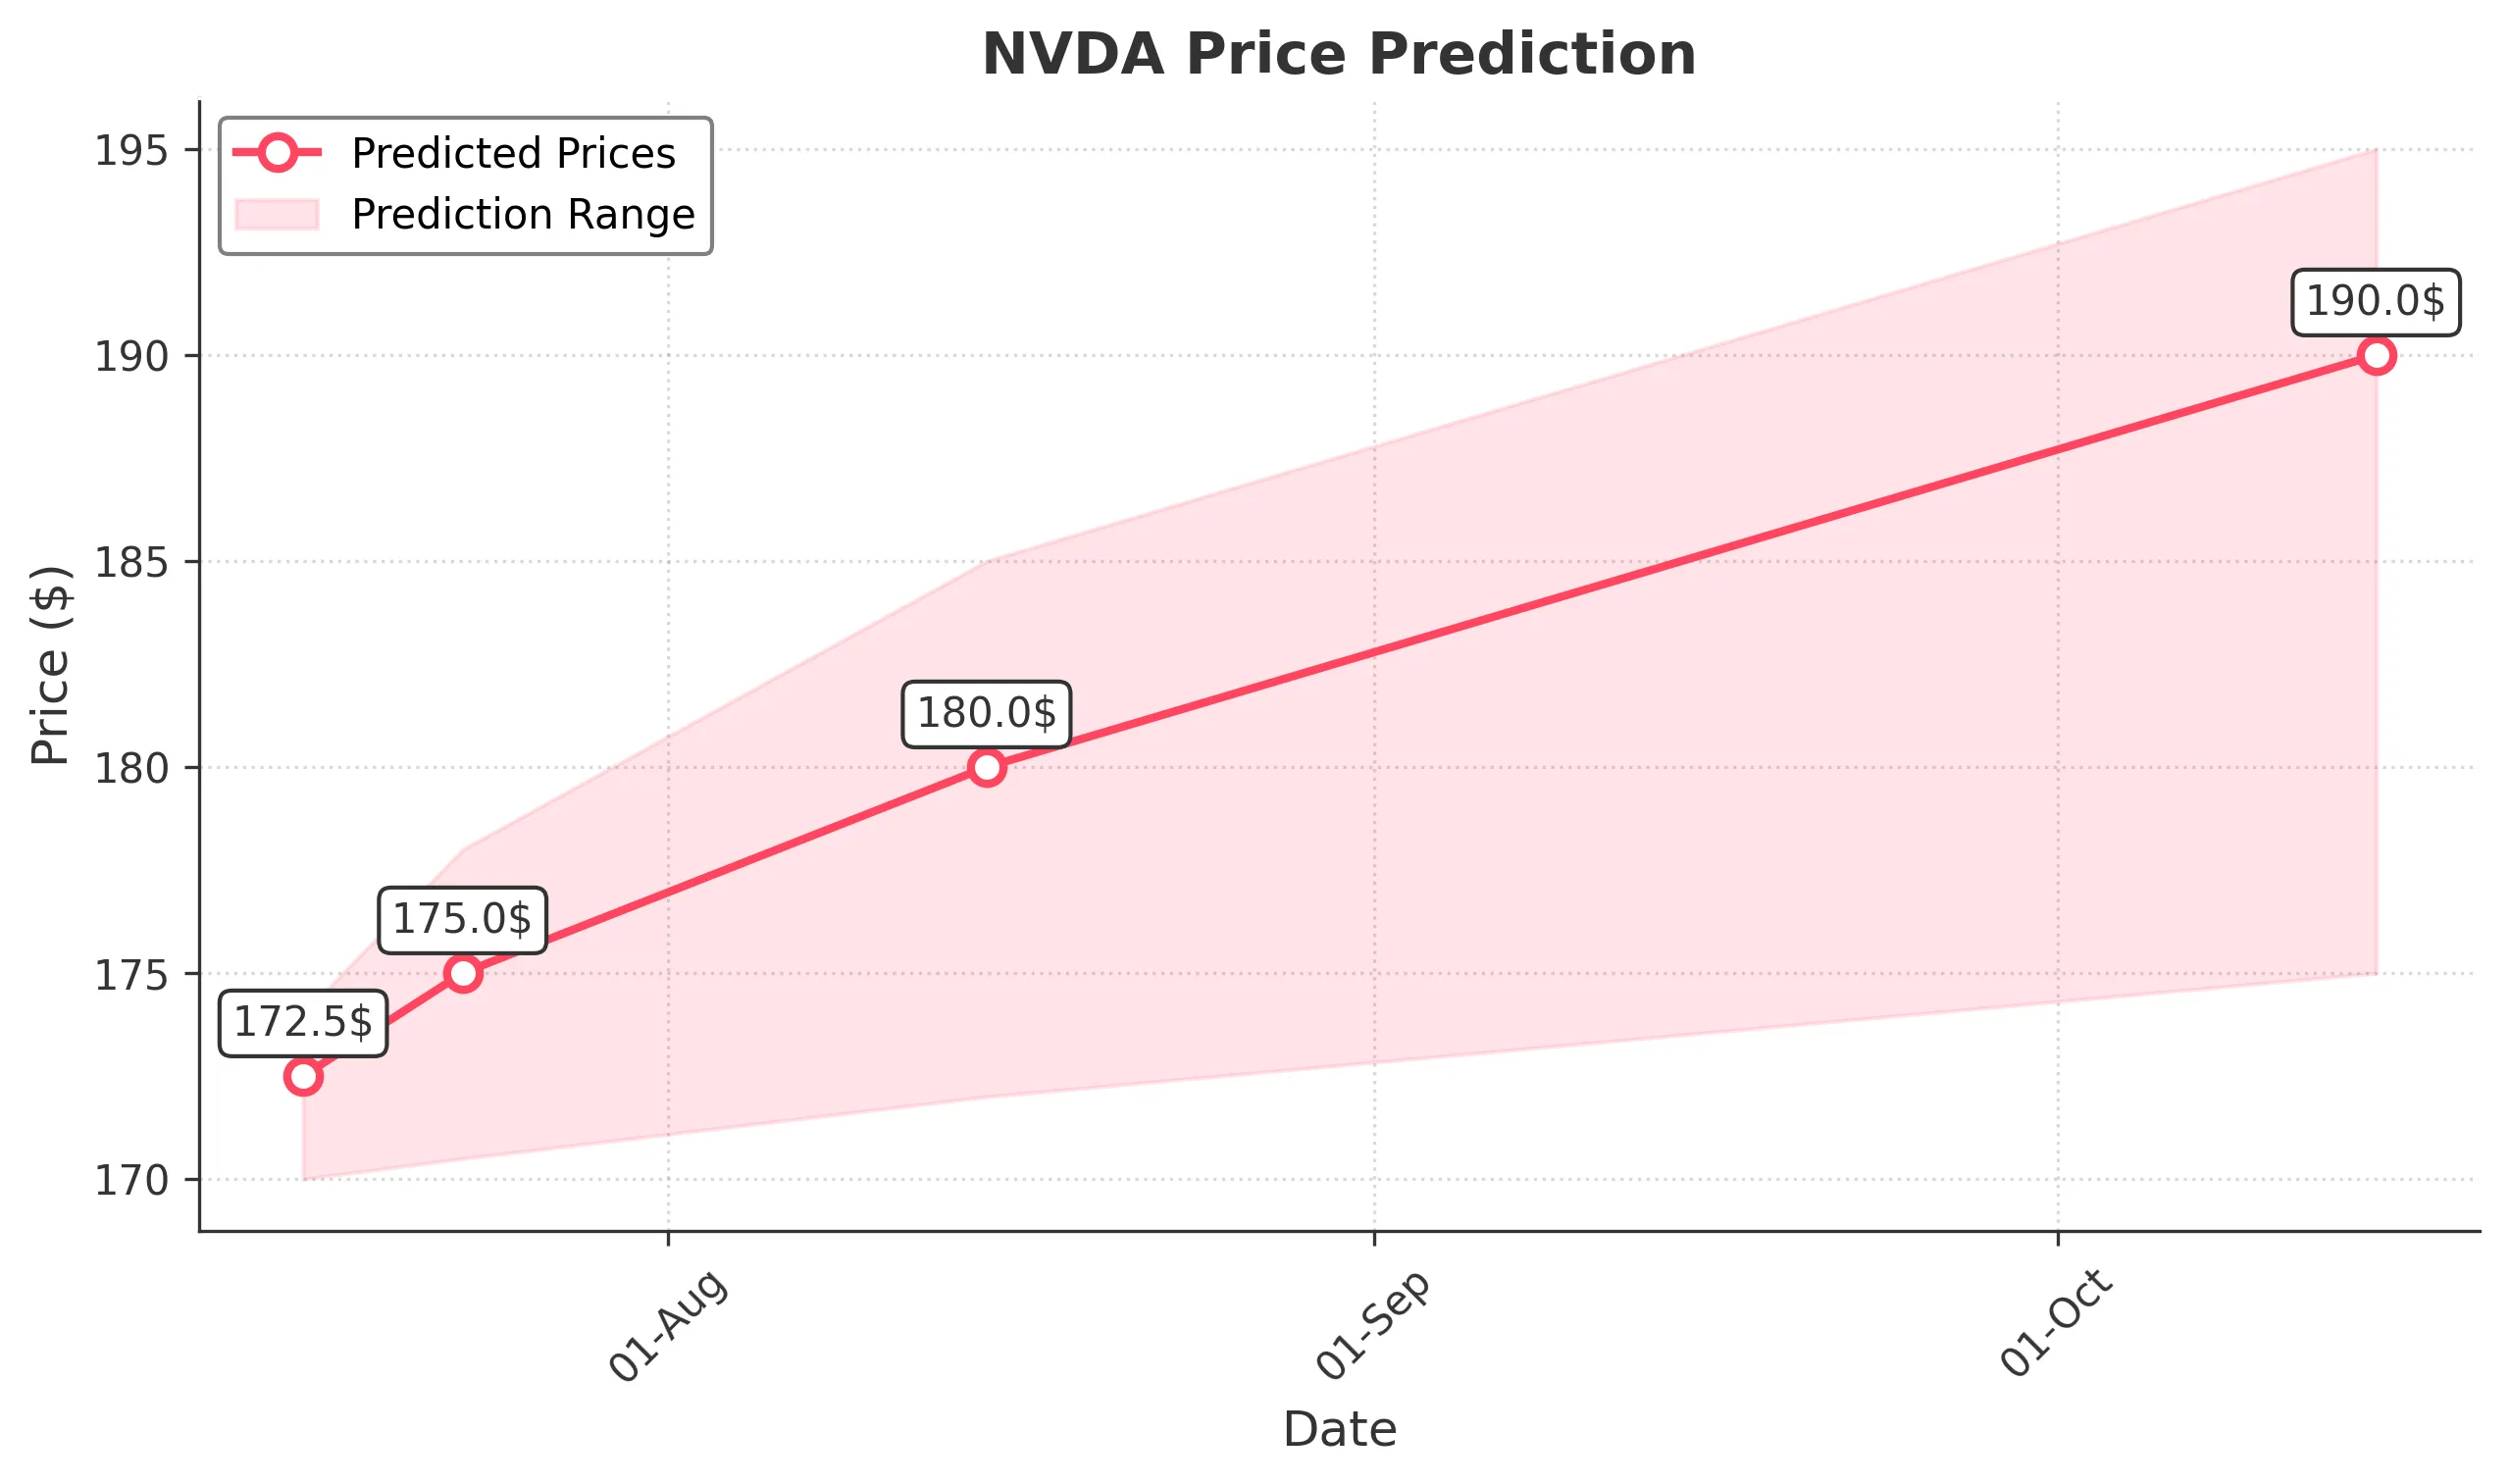
Target: July 16, 2025$172.5
$171.5
$174
$170
Description
The stock shows bullish momentum with a recent upward trend. The RSI is approaching overbought levels, indicating potential for a pullback. However, strong volume and positive market sentiment suggest a close around 172.500.
Analysis
NVDA has shown a bullish trend over the past three months, with significant support at 160 and resistance around 175. The recent price action indicates strong buying interest, but the RSI suggests caution as it nears overbought territory.
Confidence Level
Potential Risks
Potential market volatility and profit-taking could lead to a lower close.
1 Week Prediction
Target: July 23, 2025$175
$172.5
$178
$170.5
Description
The upward trend is expected to continue, supported by bullish candlestick patterns and strong volume. However, the RSI indicates potential overbought conditions, which may lead to a pullback before reaching 175.000.
Analysis
The stock has been on a bullish run, with key support at 170. The MACD is bullish, and volume spikes indicate strong buying interest. However, the market sentiment could shift due to external factors, leading to increased volatility.
Confidence Level
Potential Risks
Market corrections or negative news could impact the price trajectory.
1 Month Prediction
Target: August 15, 2025$180
$175
$185
$172
Description
Expect continued bullish momentum driven by strong earnings and market sentiment. The Fibonacci retracement levels suggest a target around 180.000, but watch for potential resistance at 185.000.
Analysis
The stock has shown resilience with a bullish trend. Key support is at 170, while resistance is at 185. The ATR indicates increasing volatility, and the market sentiment remains positive, but external factors could lead to fluctuations.
Confidence Level
Potential Risks
Earnings reports and macroeconomic events could introduce volatility.
3 Months Prediction
Target: October 15, 2025$190
$180
$195
$175
Description
Long-term bullish outlook supported by strong fundamentals and market trends. However, potential market corrections and economic factors could impact the price, leading to fluctuations around 190.000.
Analysis
Over the past three months, NVDA has shown a strong upward trend with significant support at 170. The MACD and moving averages indicate bullish momentum, but external economic factors could introduce risks, leading to potential volatility.
Confidence Level
Potential Risks
Economic downturns or sector-specific issues could lead to price declines.