NVDA Trading Predictions
1 Day Prediction
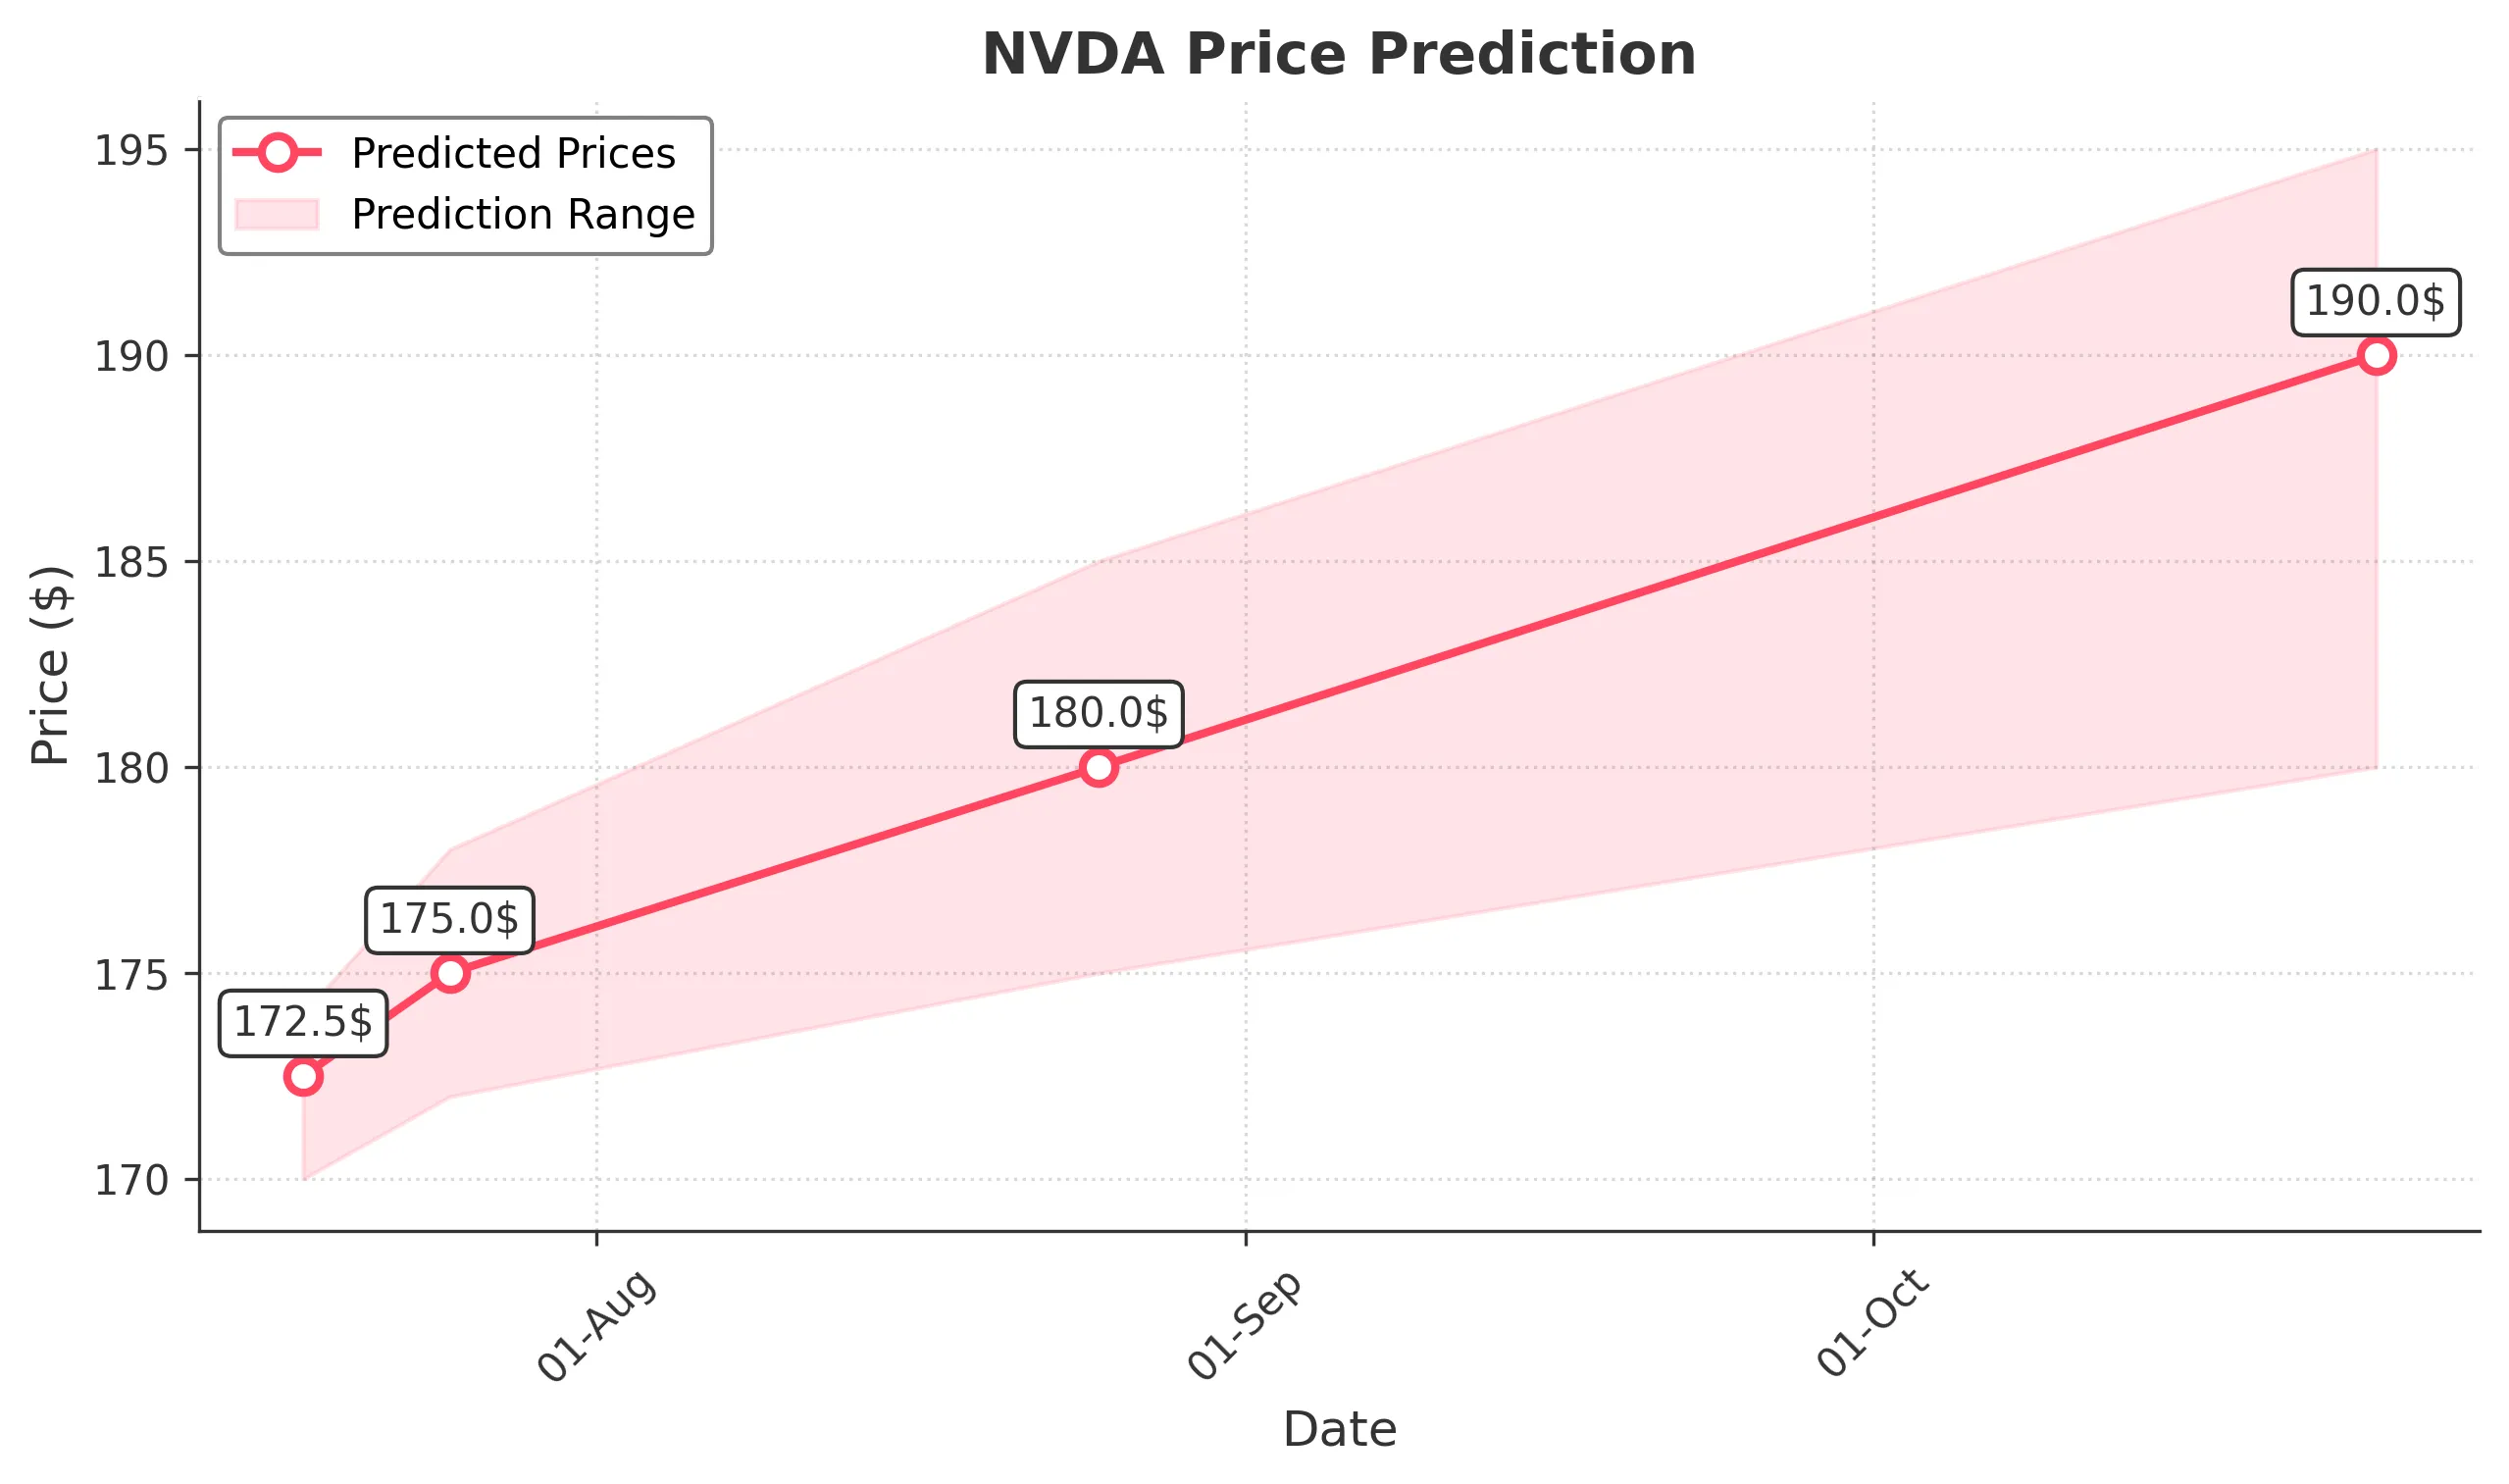
Target: July 18, 2025$172.5
$171.5
$174
$170
Description
The stock shows bullish momentum with a recent upward trend. The RSI is approaching overbought levels, indicating potential for a pullback. However, strong support at $170 and positive market sentiment may drive prices higher.
Analysis
Over the past 3 months, NVDA has shown a strong bullish trend, with significant support at $170 and resistance around $175. The MACD indicates upward momentum, while volume spikes suggest strong buying interest. However, the RSI nearing overbought levels raises caution.
Confidence Level
Potential Risks
Potential for a reversal if market sentiment shifts or if macroeconomic news impacts tech stocks.
1 Week Prediction
Target: July 25, 2025$175
$173.5
$178
$172
Description
The bullish trend is expected to continue, supported by strong earnings reports and positive market sentiment. However, the RSI indicates potential overbought conditions, which could lead to a short-term pullback.
Analysis
NVDA has maintained a bullish trend with key support at $170. The MACD is positive, and volume trends indicate strong buying. However, the RSI suggests caution as it approaches overbought territory, indicating a possible correction.
Confidence Level
Potential Risks
Market volatility and external economic factors could impact the stock's performance.
1 Month Prediction
Target: August 25, 2025$180
$177
$185
$175
Description
Continued bullish momentum is expected as NVDA capitalizes on strong market demand. However, the potential for profit-taking and macroeconomic uncertainties could lead to volatility.
Analysis
The stock has shown a strong upward trend, with resistance at $185. The MACD remains bullish, but the RSI indicates overbought conditions. Volume patterns suggest strong interest, but external factors could introduce volatility.
Confidence Level
Potential Risks
Economic indicators and earnings reports could lead to unexpected price movements.
3 Months Prediction
Target: October 25, 2025$190
$185
$195
$180
Description
Long-term bullish outlook supported by strong fundamentals and market demand. However, potential economic downturns or tech sector corrections could impact performance.
Analysis
Over the past 3 months, NVDA has shown a strong bullish trend with key support at $180. The MACD is positive, but the RSI indicates potential overbought conditions. Volume trends suggest strong buying interest, but external economic factors could introduce volatility.
Confidence Level
Potential Risks
Market corrections and economic shifts could lead to significant price fluctuations.