NVDA Trading Predictions
1 Day Prediction
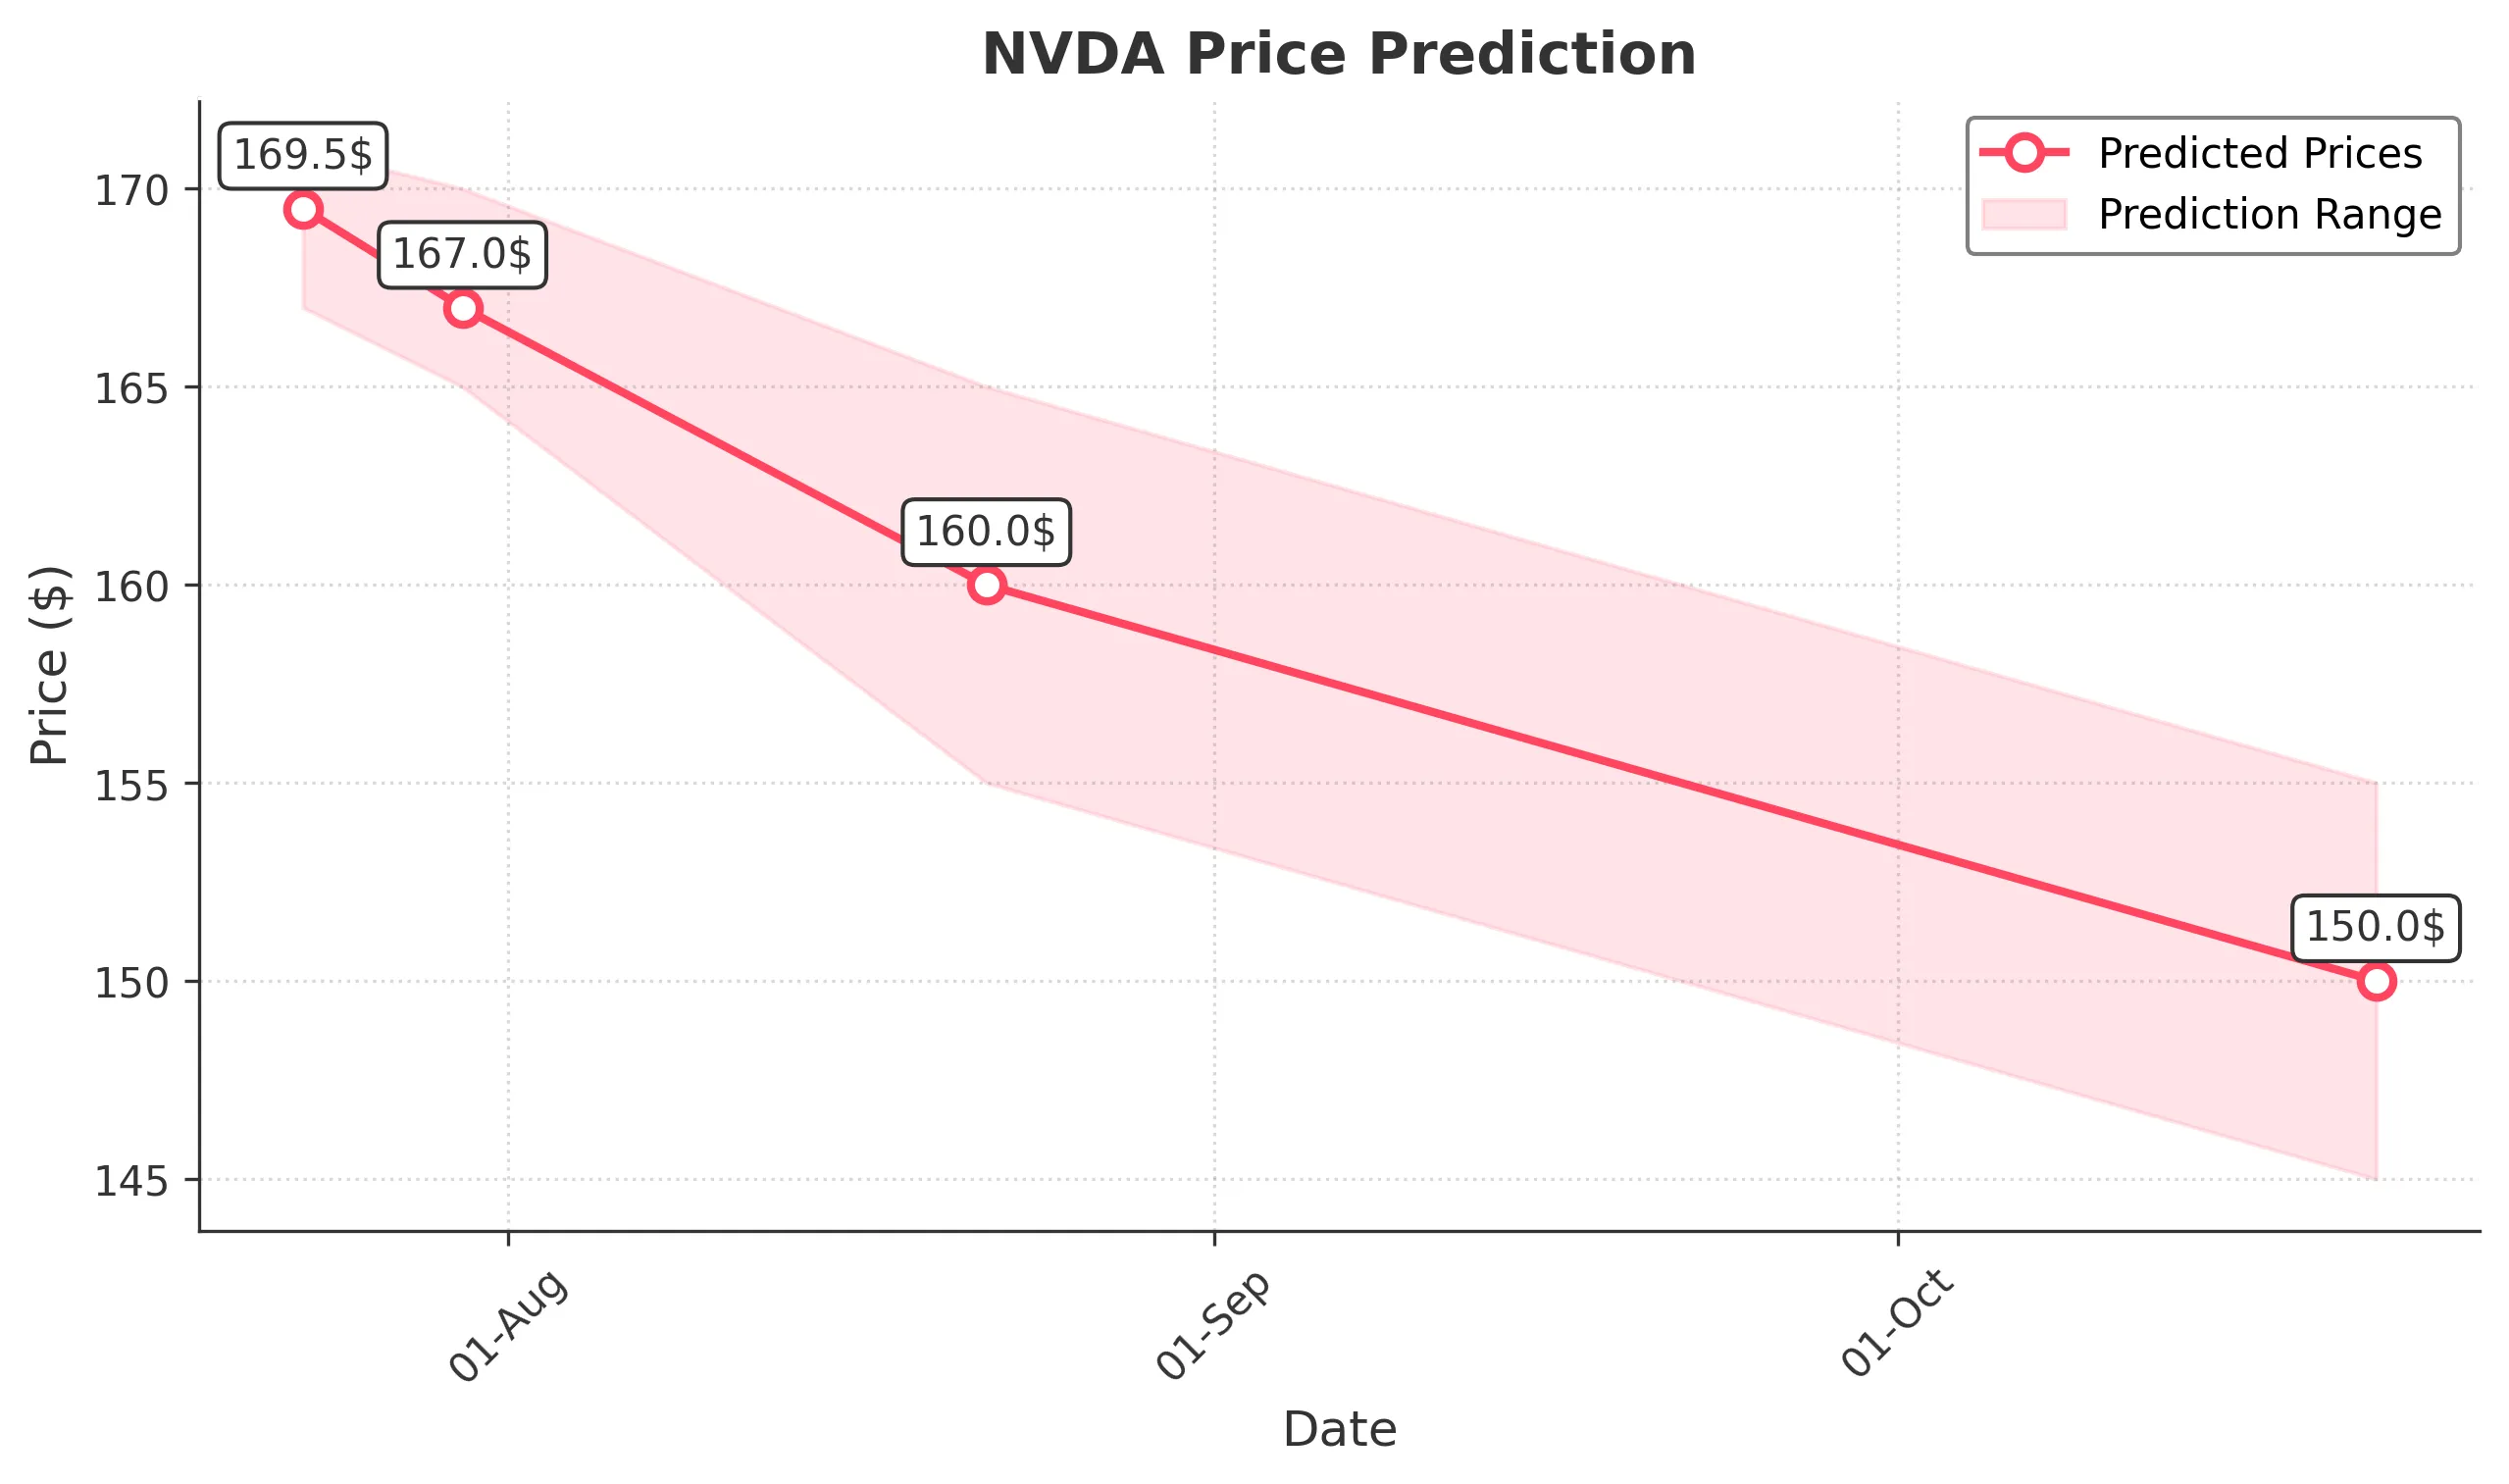
Target: July 23, 2025$169.5
$169
$171
$167
Description
The stock shows a slight bearish trend with recent lower highs. RSI indicates overbought conditions, suggesting a potential pullback. Volume has decreased, indicating weakening momentum. Expect a close around 169.50.
Analysis
Over the past 3 months, NVDA has shown a bullish trend with significant price increases. Key resistance at 173.00 and support around 168.00. Recent candlestick patterns indicate potential exhaustion. Volume spikes suggest profit-taking.
Confidence Level
Potential Risks
Market volatility and external news could impact the prediction. A reversal pattern could emerge if bullish sentiment returns.
1 Week Prediction
Target: July 30, 2025$167
$168.5
$170
$165
Description
A bearish trend is anticipated as the stock faces resistance at 171.00. The MACD shows a bearish crossover, and RSI is approaching overbought levels. Expect a close around 167.00 as profit-taking may continue.
Analysis
The stock has been volatile, with significant price swings. Key support at 165.00 and resistance at 171.00. Recent volume patterns indicate profit-taking, and the overall sentiment is cautious.
Confidence Level
Potential Risks
Unforeseen market events or earnings reports could lead to volatility. A bullish reversal is possible if sentiment shifts.
1 Month Prediction
Target: August 22, 2025$160
$162
$165
$155
Description
Expect continued bearish pressure as the stock approaches key support levels. The Bollinger Bands indicate potential for a breakout, but current trends suggest a decline towards 160.00.
Analysis
The stock has shown a bearish trend with significant resistance at 171.00. Key support at 155.00. Technical indicators suggest weakening momentum, and volume patterns indicate potential selling pressure.
Confidence Level
Potential Risks
Market sentiment can shift rapidly, and external factors may influence price. A bullish reversal could occur if positive news emerges.
3 Months Prediction
Target: October 22, 2025$150
$152
$155
$145
Description
Long-term bearish outlook as the stock may test lower support levels. The overall trend suggests a decline, with potential for a close around 150.00 as market sentiment remains cautious.
Analysis
The stock has been in a volatile phase with significant price fluctuations. Key support at 145.00 and resistance at 171.00. Technical indicators suggest a bearish trend, and volume patterns indicate potential selling pressure.
Confidence Level
Potential Risks
Economic conditions and market sentiment could change, leading to unexpected price movements. A bullish reversal is possible if market conditions improve.