NVDA Trading Predictions
1 Day Prediction
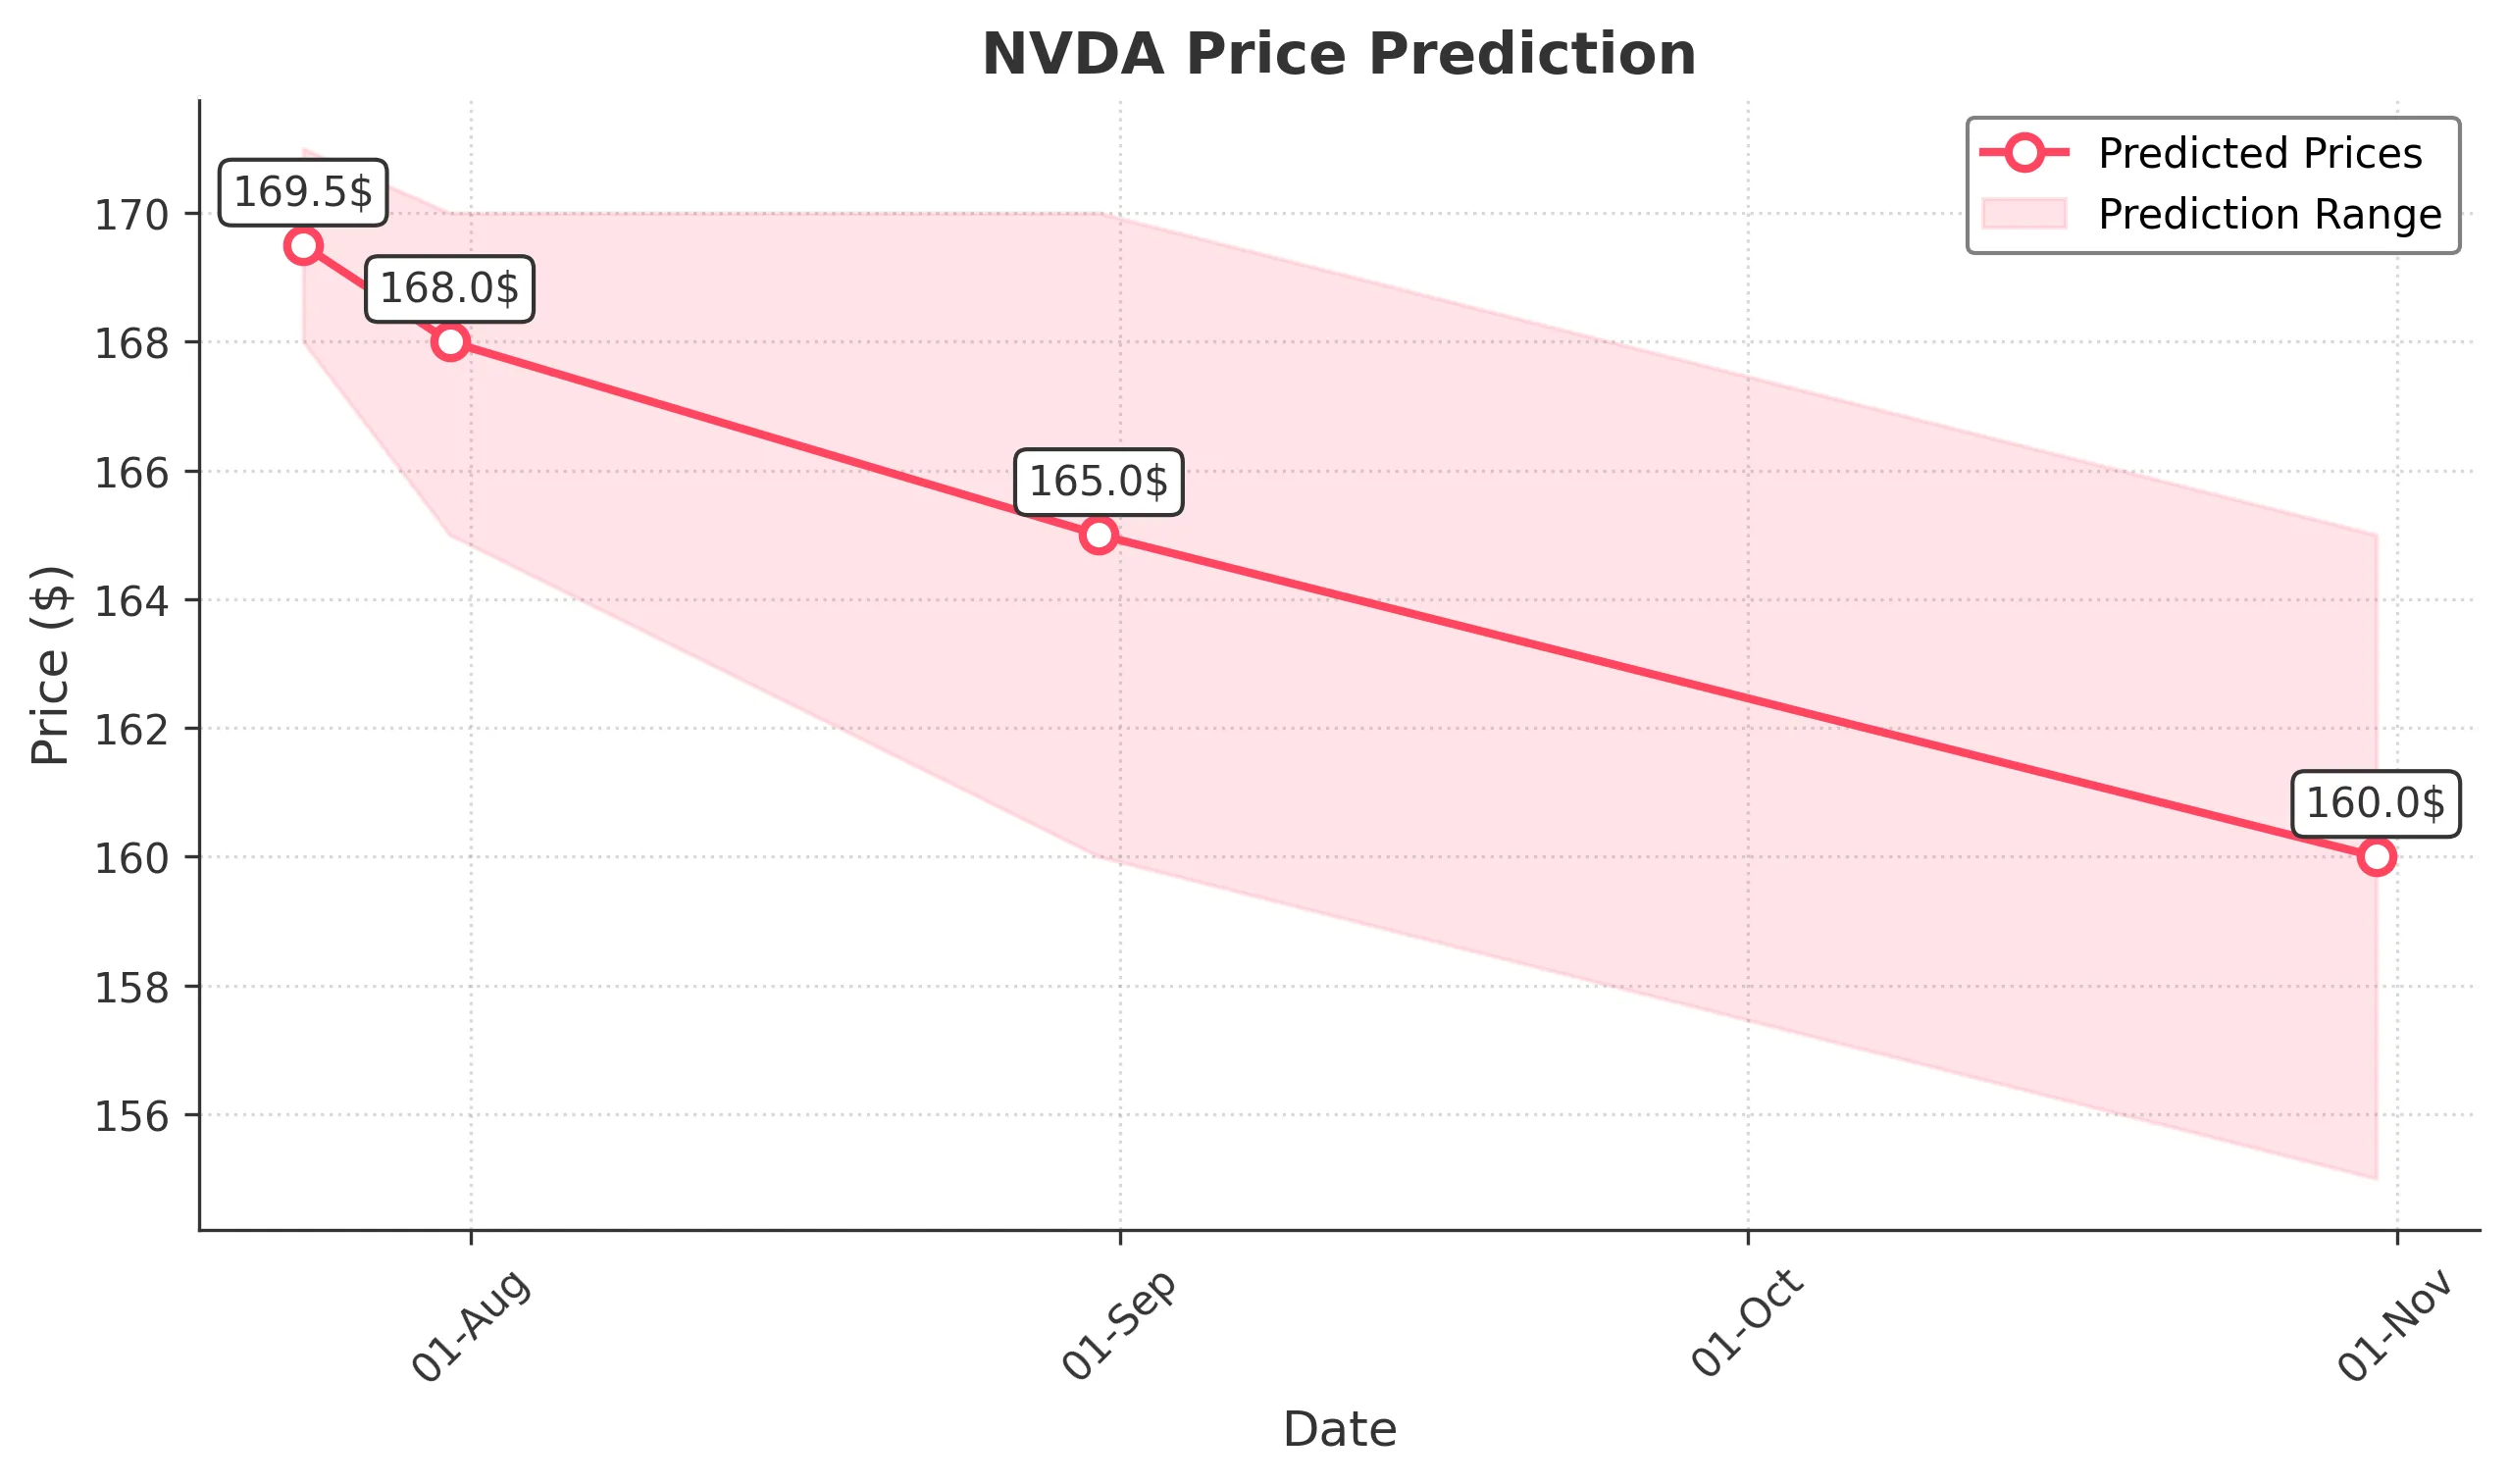
Target: July 24, 2025$169.5
$170
$171
$168
Description
The stock shows a slight bearish trend with a potential pullback after recent highs. RSI indicates overbought conditions, while MACD shows a bearish crossover. Volume has decreased, suggesting weakening momentum. Expect a close around 169.50.
Analysis
Over the past 3 months, NVDA has shown a bullish trend with significant upward movement, peaking at 173.00. Key support is around 167.00, while resistance is near 174.00. Recent candlestick patterns indicate potential reversal signals, and volume has been inconsistent, suggesting caution.
Confidence Level
Potential Risks
Market volatility and external news could impact the prediction. A sudden bullish sentiment could lead to higher prices.
1 Week Prediction
Target: July 31, 2025$168
$169
$170
$165
Description
Expect continued bearish pressure as the stock may test lower support levels. The RSI remains high, indicating potential overbought conditions. A close around 168.00 is likely as traders take profits.
Analysis
The stock has been in a bullish phase but is showing signs of fatigue. Key support at 167.00 is critical, and a break below could lead to further declines. Volume patterns suggest profit-taking, and the overall market sentiment is cautious.
Confidence Level
Potential Risks
Unforeseen market events or earnings reports could lead to volatility. A bullish reversal is possible if sentiment shifts.
1 Month Prediction
Target: August 31, 2025$165
$167
$170
$160
Description
A bearish trend is anticipated as the stock may continue to decline towards key support levels. The MACD indicates weakening momentum, and RSI suggests overbought conditions. Expect a close around 165.00.
Analysis
The stock has shown strong performance but is now facing resistance. Key support at 160.00 is crucial. Technical indicators suggest a potential pullback, and volume trends indicate profit-taking. The overall market sentiment is mixed.
Confidence Level
Potential Risks
Market sentiment can shift rapidly, and any positive news could reverse the trend. Watch for earnings reports that may influence price.
3 Months Prediction
Target: October 31, 2025$160
$162
$165
$155
Description
Long-term bearish outlook as the stock may continue to decline. Key support levels are being tested, and technical indicators suggest a potential downtrend. Expect a close around 160.00.
Analysis
The stock has been in a bullish trend but is now showing signs of weakness. Key support at 155.00 is critical. Technical indicators suggest a potential downtrend, and volume patterns indicate profit-taking. The overall market sentiment is cautious, with potential external influences.
Confidence Level
Potential Risks
Macroeconomic factors and market sentiment could significantly impact the stock's performance. A bullish reversal is possible if market conditions improve.