NVDA Trading Predictions
1 Day Prediction
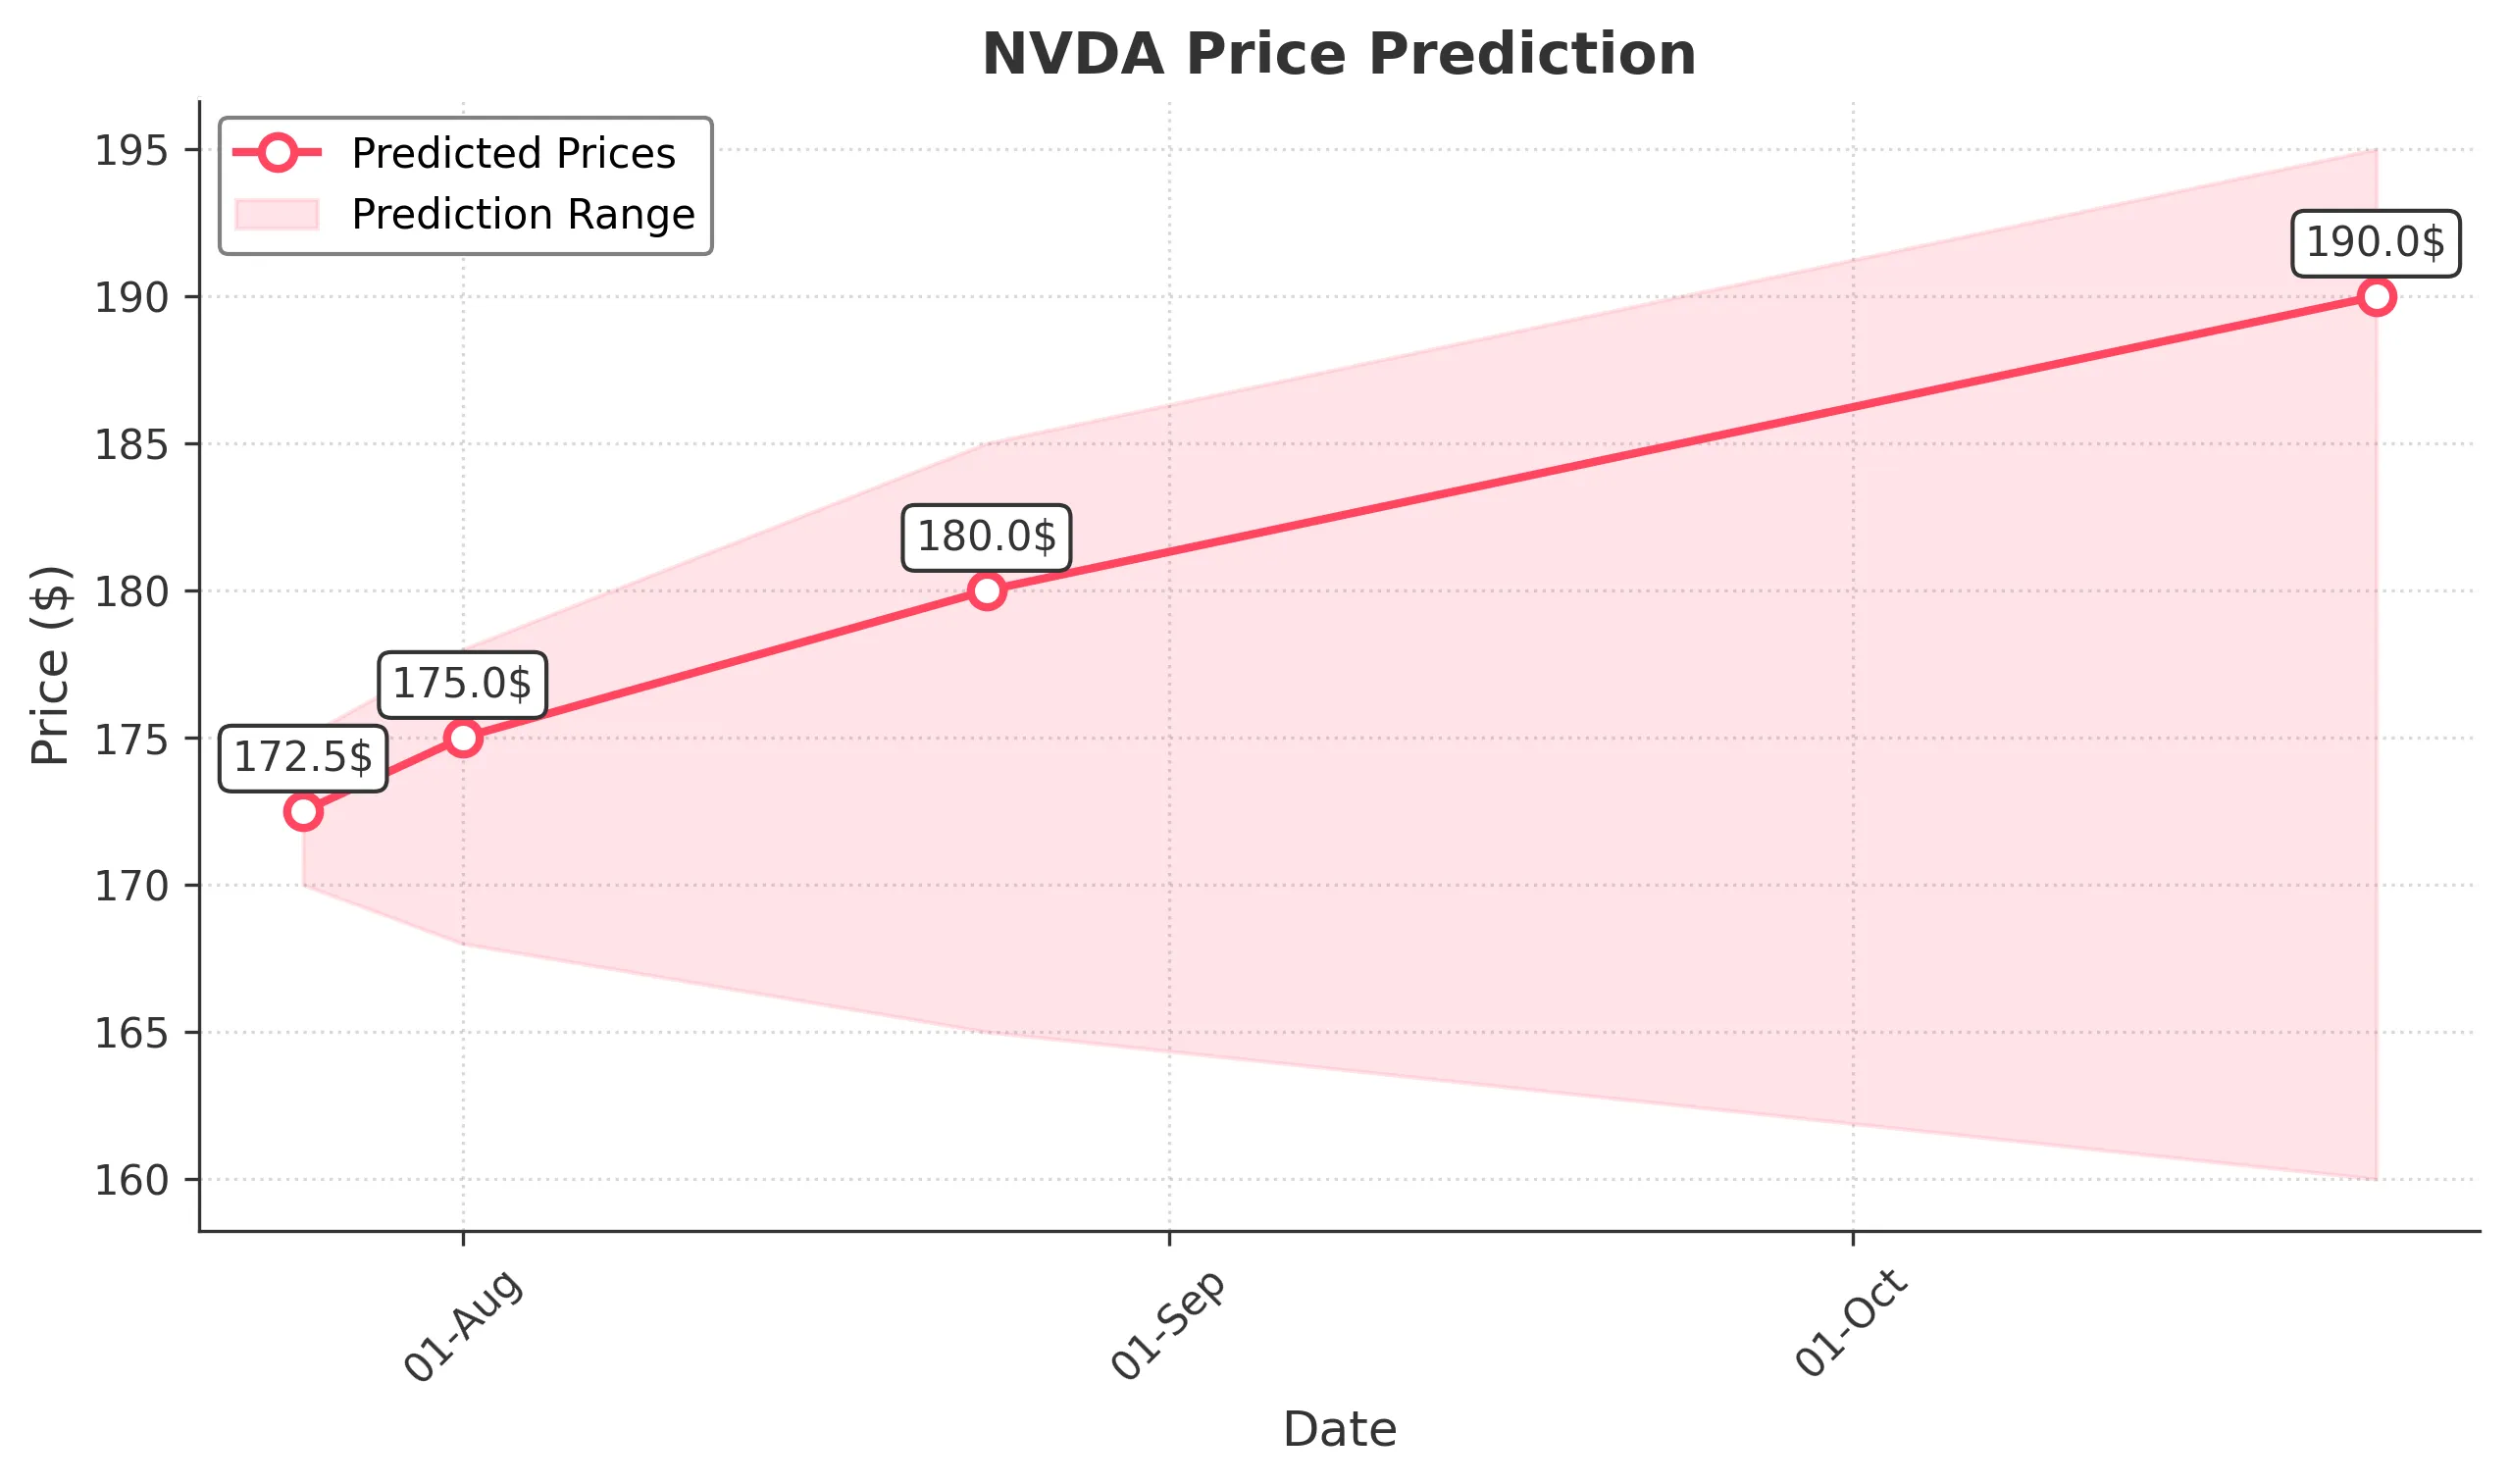
Target: July 25, 2025$172.5
$172
$175
$170
Description
The stock shows a bullish trend with recent upward momentum. The RSI is nearing overbought levels, indicating potential for a pullback. However, strong support at 170 and resistance at 175 suggest a range-bound movement. Volume remains healthy.
Analysis
Over the past 3 months, NVDA has shown a bullish trend, with significant upward movement and a recent peak at 173.25. Key support is at 170, while resistance is at 175. The MACD indicates bullish momentum, but the RSI suggests caution as it approaches overbought territory.
Confidence Level
Potential Risks
Potential for a reversal exists if market sentiment shifts or if macroeconomic news impacts tech stocks.
1 Week Prediction
Target: August 1, 2025$175
$172.5
$178
$168
Description
The stock is expected to continue its upward trajectory, supported by strong buying interest. However, the RSI indicates overbought conditions, which may lead to volatility. Watch for potential resistance at 178.
Analysis
NVDA has maintained a bullish trend, with recent highs indicating strong investor interest. The MACD remains positive, but the RSI suggests caution. Volume patterns show increased activity, indicating strong market participation.
Confidence Level
Potential Risks
Market volatility and external economic factors could impact the stock's performance, leading to unexpected price movements.
1 Month Prediction
Target: August 24, 2025$180
$175
$185
$165
Description
Expect continued bullish momentum, with potential for new highs as market sentiment remains positive. However, watch for profit-taking as the stock approaches resistance levels.
Analysis
The stock has shown strong performance, but the potential for a pullback exists as it approaches key resistance levels. The MACD remains bullish, but the RSI indicates overbought conditions. Volume trends suggest strong interest, but caution is warranted.
Confidence Level
Potential Risks
Market corrections and external economic news could lead to increased volatility and impact the stock's upward trajectory.
3 Months Prediction
Target: October 24, 2025$190
$180
$195
$160
Description
Long-term bullish outlook as NVDA continues to capitalize on market trends. However, potential for volatility exists due to macroeconomic factors and earnings reports.
Analysis
Over the past three months, NVDA has shown a strong upward trend, but the potential for market corrections exists. Key support is at 160, while resistance is at 195. The MACD indicates bullish momentum, but external factors could introduce volatility.
Confidence Level
Potential Risks
Unforeseen market events or earnings surprises could lead to significant price fluctuations, impacting the prediction's accuracy.