NVDA Trading Predictions
1 Day Prediction
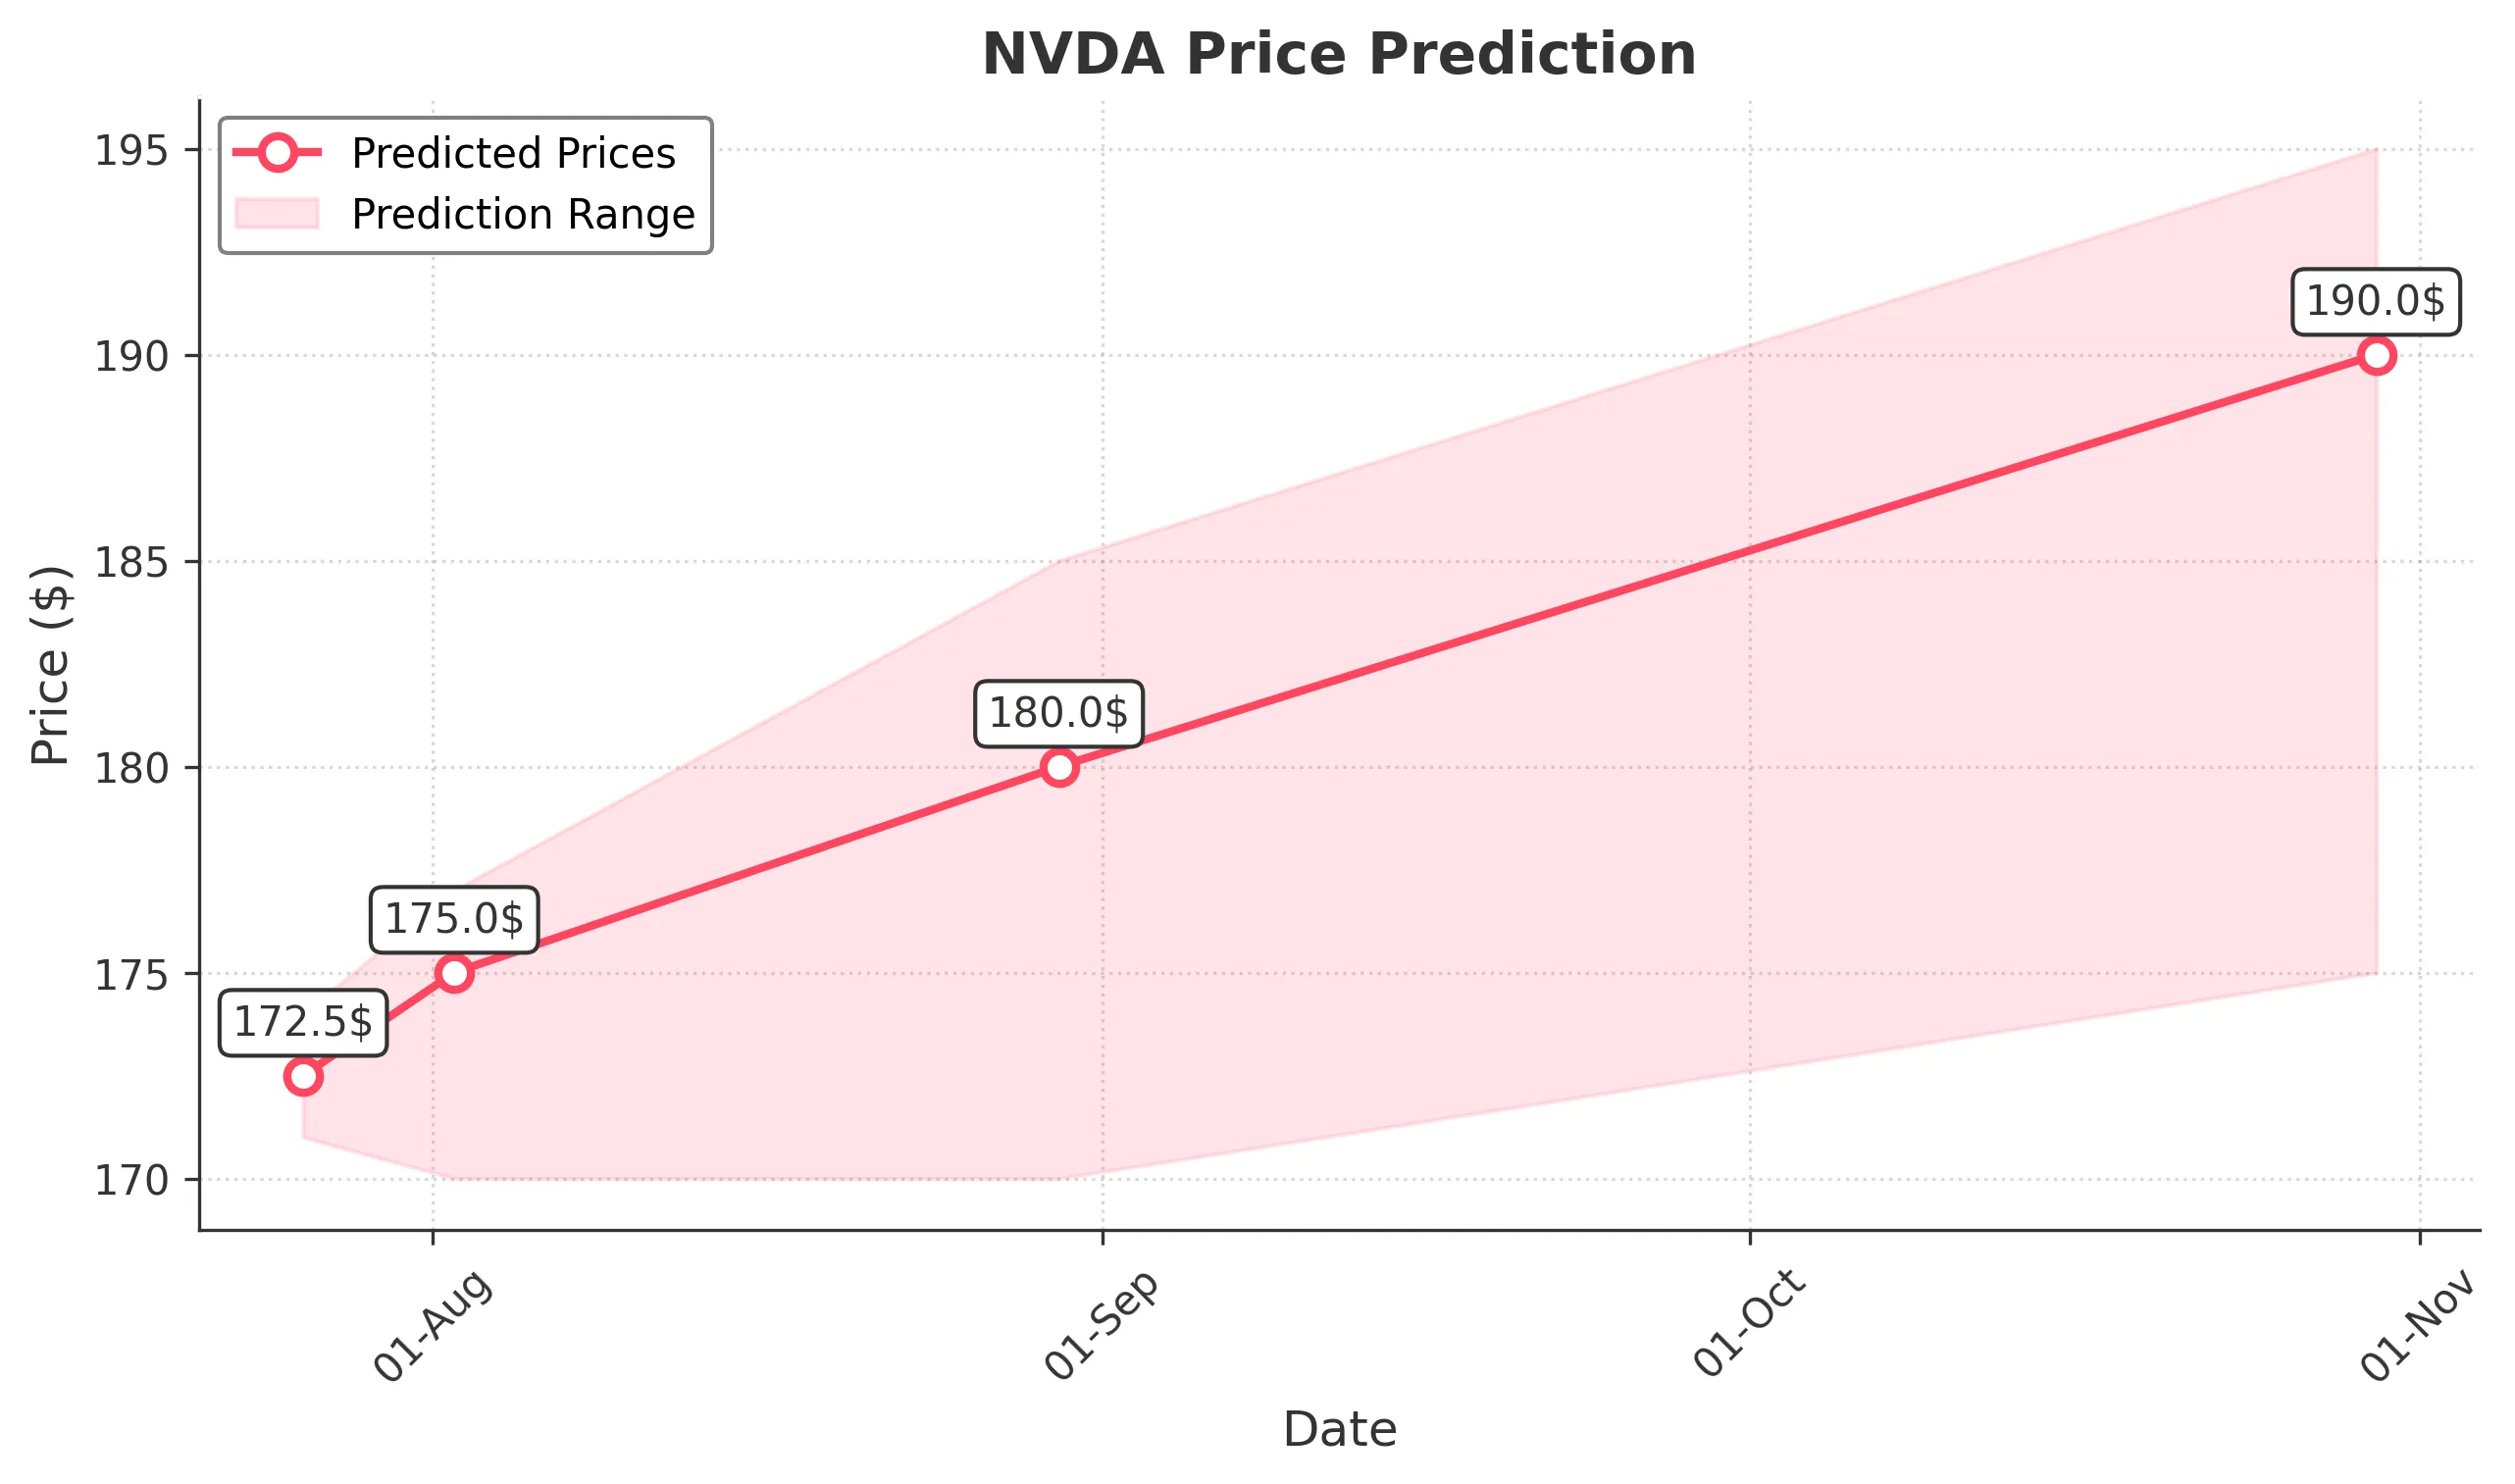
Target: July 26, 2025$172.5
$173
$174
$171
Description
The stock shows a slight bullish trend with a recent Doji pattern indicating indecision. The RSI is around 55, suggesting room for upward movement. However, MACD is flattening, indicating potential consolidation.
Analysis
Over the past 3 months, NVDA has shown a bullish trend with significant upward momentum, reaching a peak of 173.74. Key support is at 171.00, while resistance is at 175.00. Volume has been strong, indicating investor interest. However, recent candlestick patterns suggest potential consolidation.
Confidence Level
Potential Risks
Market volatility and external news could impact the price. A bearish reversal is possible if the support at 171.00 fails.
1 Week Prediction
Target: August 2, 2025$175
$172.5
$177
$170
Description
The stock is expected to continue its upward trajectory, supported by a bullish MACD crossover. The RSI is approaching overbought territory, indicating potential for a pullback. Watch for volume spikes as confirmation.
Analysis
NVDA has maintained a bullish trend, with strong support at 171.00 and resistance at 175.00. The recent price action shows higher highs and higher lows, indicating a strong uptrend. However, the RSI nearing overbought levels suggests caution.
Confidence Level
Potential Risks
If the market sentiment shifts negatively, it could lead to a quick reversal. Earnings reports or macroeconomic data could also influence the stock's performance.
1 Month Prediction
Target: August 30, 2025$180
$175
$185
$170
Description
The stock is projected to reach 180.00 as bullish momentum continues. Fibonacci retracement levels suggest strong support at 171.00. However, the RSI indicates potential overbought conditions, warranting caution.
Analysis
In the last three months, NVDA has shown a strong bullish trend, with significant volume supporting price increases. Key resistance is at 185.00, while support remains at 171.00. The stock's performance is influenced by broader market trends and tech sector dynamics.
Confidence Level
Potential Risks
Market corrections or negative news could lead to a pullback. The potential for profit-taking may also impact the upward trend.
3 Months Prediction
Target: October 30, 2025$190
$180
$195
$175
Description
The stock is expected to reach 190.00, driven by continued bullish sentiment and strong earnings potential. However, the RSI indicates overbought conditions, suggesting a possible correction.
Analysis
NVDA has shown a robust performance over the past three months, with a clear upward trend. Key support is at 175.00, while resistance is at 195.00. The stock's performance is closely tied to market sentiment and macroeconomic conditions.
Confidence Level
Potential Risks
Economic factors, such as interest rate changes or geopolitical events, could negatively impact the stock. A significant market downturn could also lead to a price drop.