NVDA Trading Predictions
1 Day Prediction
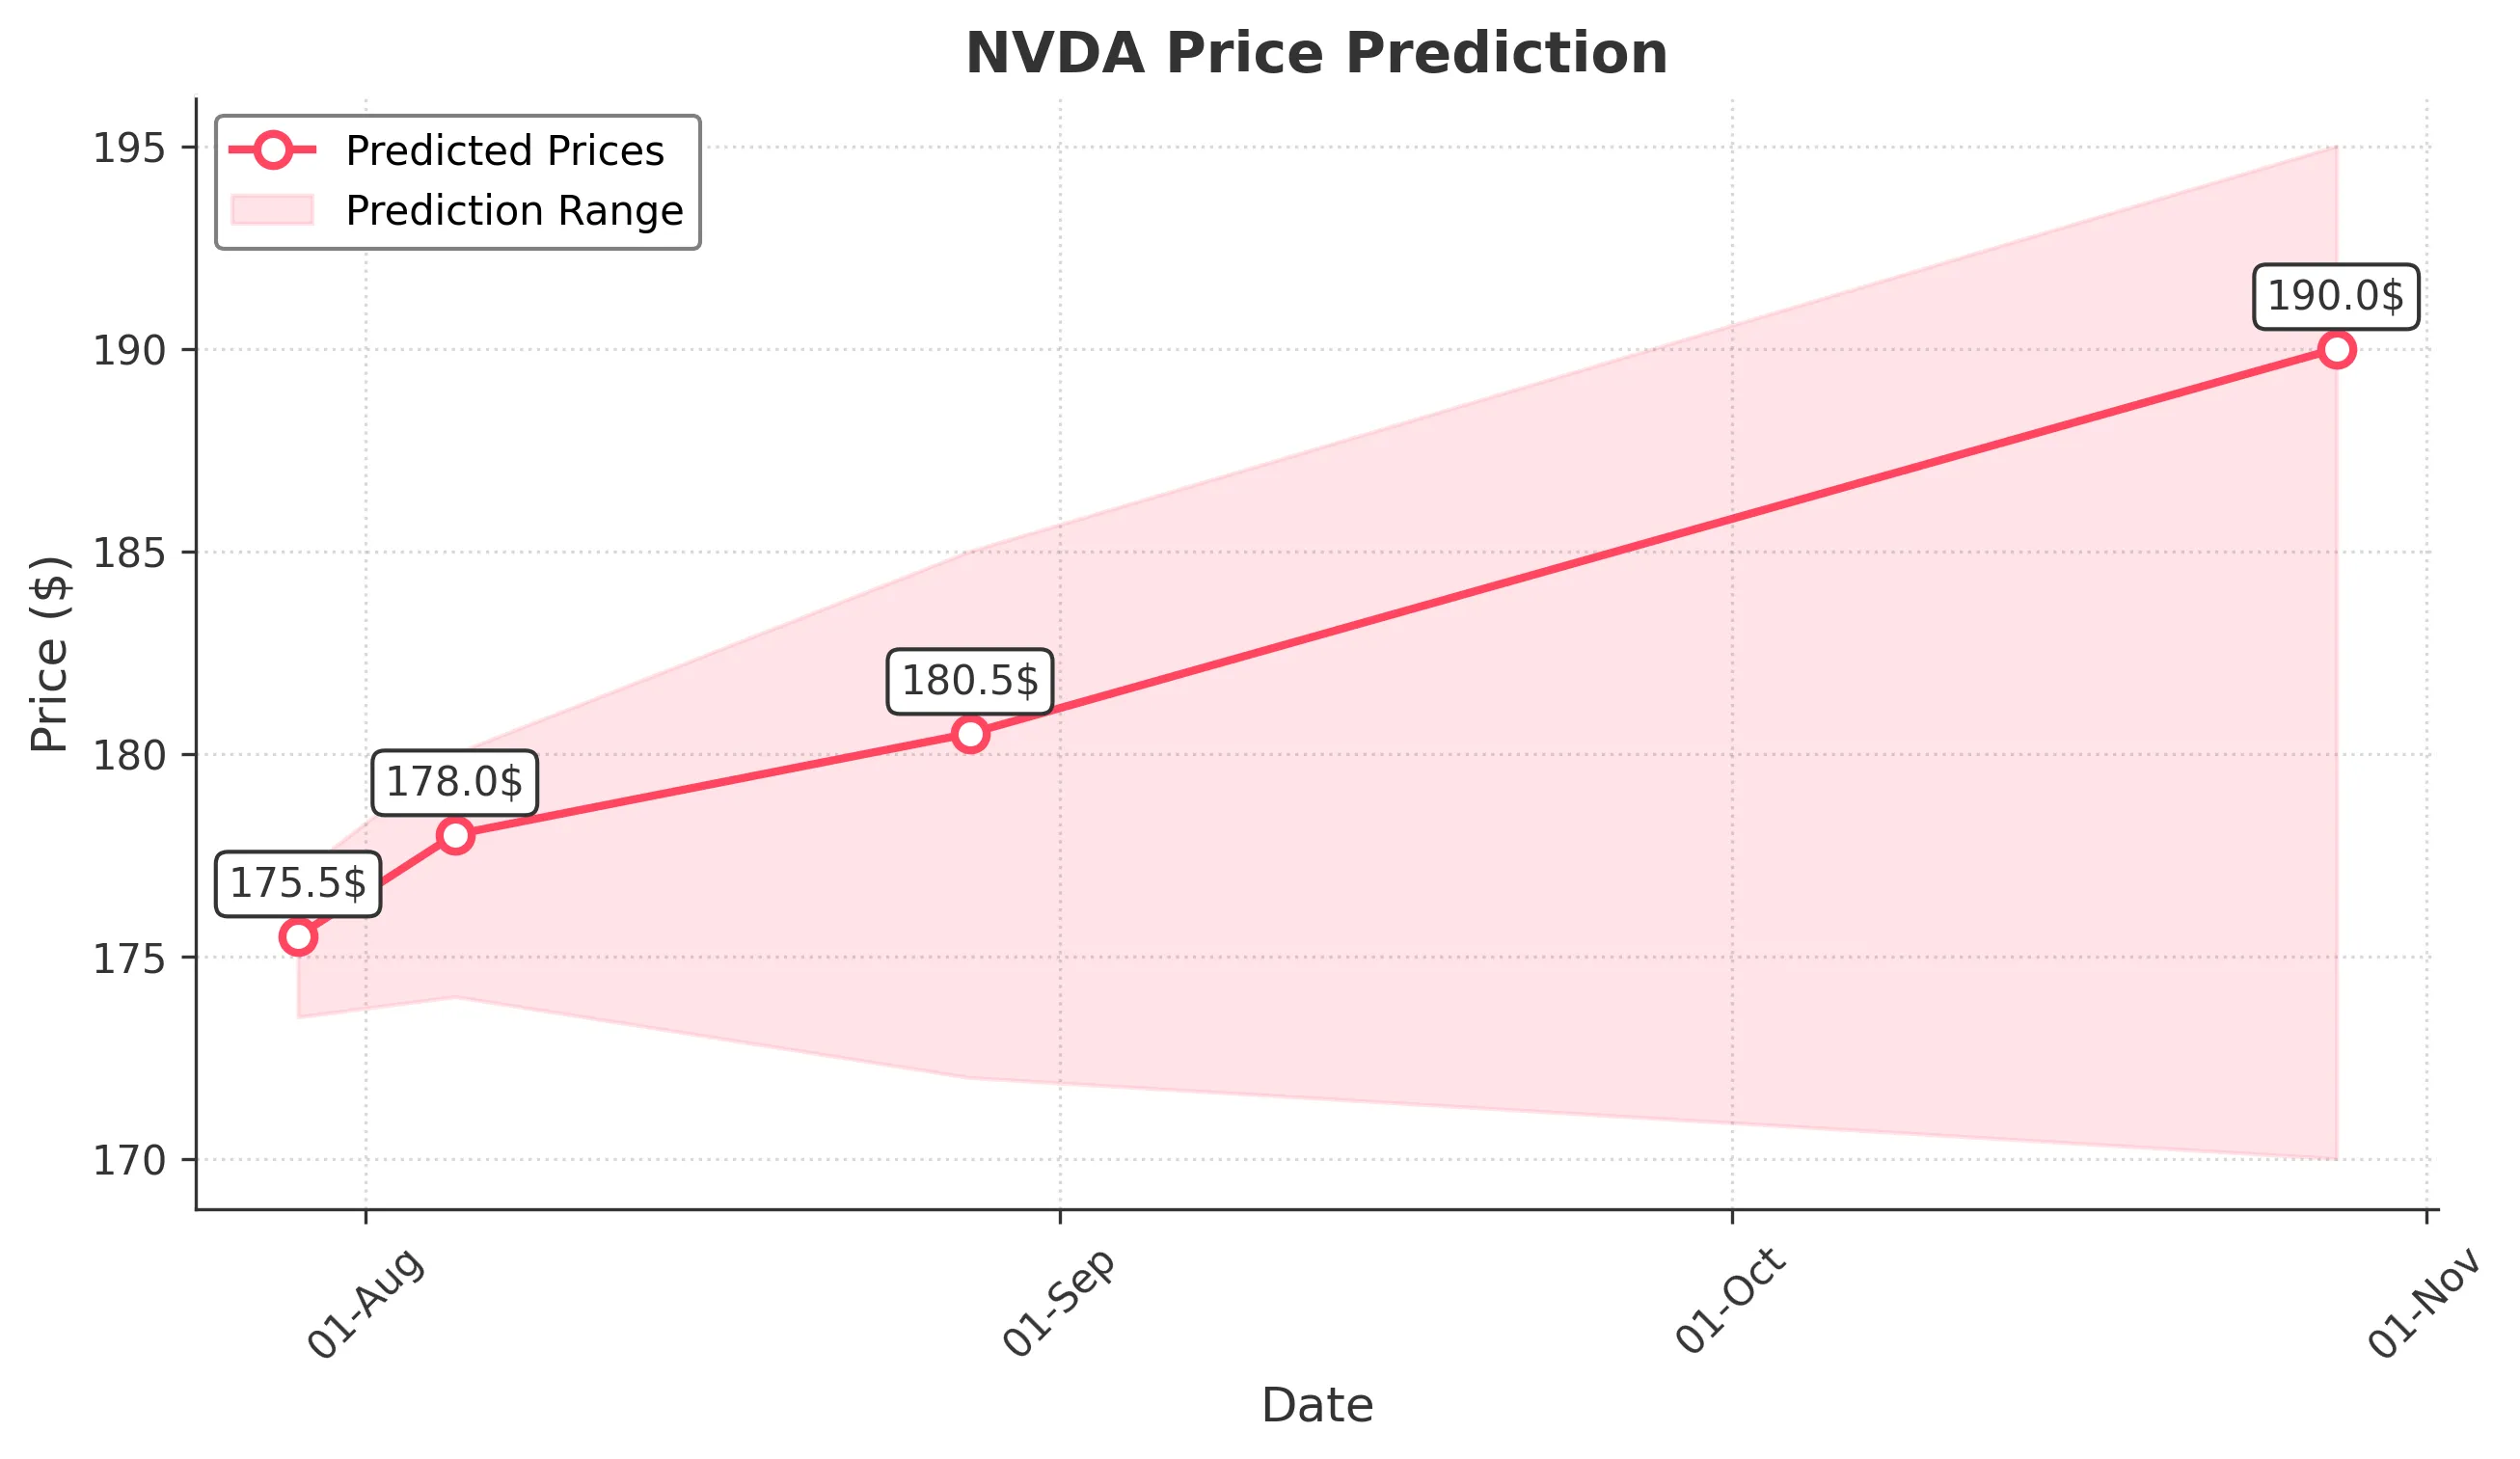
Target: July 29, 2025$175.5
$175
$177
$173.5
Description
The stock shows bullish momentum with a recent upward trend. The RSI is approaching overbought levels, indicating potential for a pullback. However, strong volume and a bullish candlestick pattern suggest continued upward movement.
Analysis
Over the past 3 months, NVDA has shown a strong bullish trend, with significant support at $170 and resistance around $177. The MACD indicates upward momentum, while the ATR suggests moderate volatility. Recent volume spikes indicate strong buying interest.
Confidence Level
Potential Risks
Potential market corrections or profit-taking could impact the price.
1 Week Prediction
Target: August 5, 2025$178
$176.5
$180
$174
Description
The bullish trend is expected to continue, supported by strong earnings sentiment and positive market conditions. However, the RSI indicates overbought conditions, which may lead to short-term corrections.
Analysis
The stock has maintained a bullish trend with key support at $170. The MACD is positive, and the Bollinger Bands suggest potential for further upward movement. However, the RSI nearing overbought levels raises concerns for a possible pullback.
Confidence Level
Potential Risks
Market volatility and external economic factors could lead to unexpected price movements.
1 Month Prediction
Target: August 28, 2025$180.5
$179
$185
$172
Description
Continued bullish sentiment is expected, driven by strong fundamentals and market demand. However, the potential for profit-taking and market corrections remains a risk.
Analysis
The stock has shown resilience with a strong upward trend. Key resistance is at $185, while support remains at $170. The MACD and moving averages indicate bullish momentum, but the RSI suggests caution due to overbought conditions.
Confidence Level
Potential Risks
Economic data releases and geopolitical events could impact market sentiment.
3 Months Prediction
Target: October 28, 2025$190
$188
$195
$170
Description
Long-term bullish outlook supported by strong earnings growth and market expansion. However, potential economic downturns and market corrections could pose risks.
Analysis
The stock has shown a strong bullish trend over the past three months, with significant support at $170 and resistance at $195. The MACD indicates continued upward momentum, but external economic factors could introduce volatility.
Confidence Level
Potential Risks
Unforeseen macroeconomic events could lead to volatility and price corrections.