NVDA Trading Predictions
1 Day Prediction
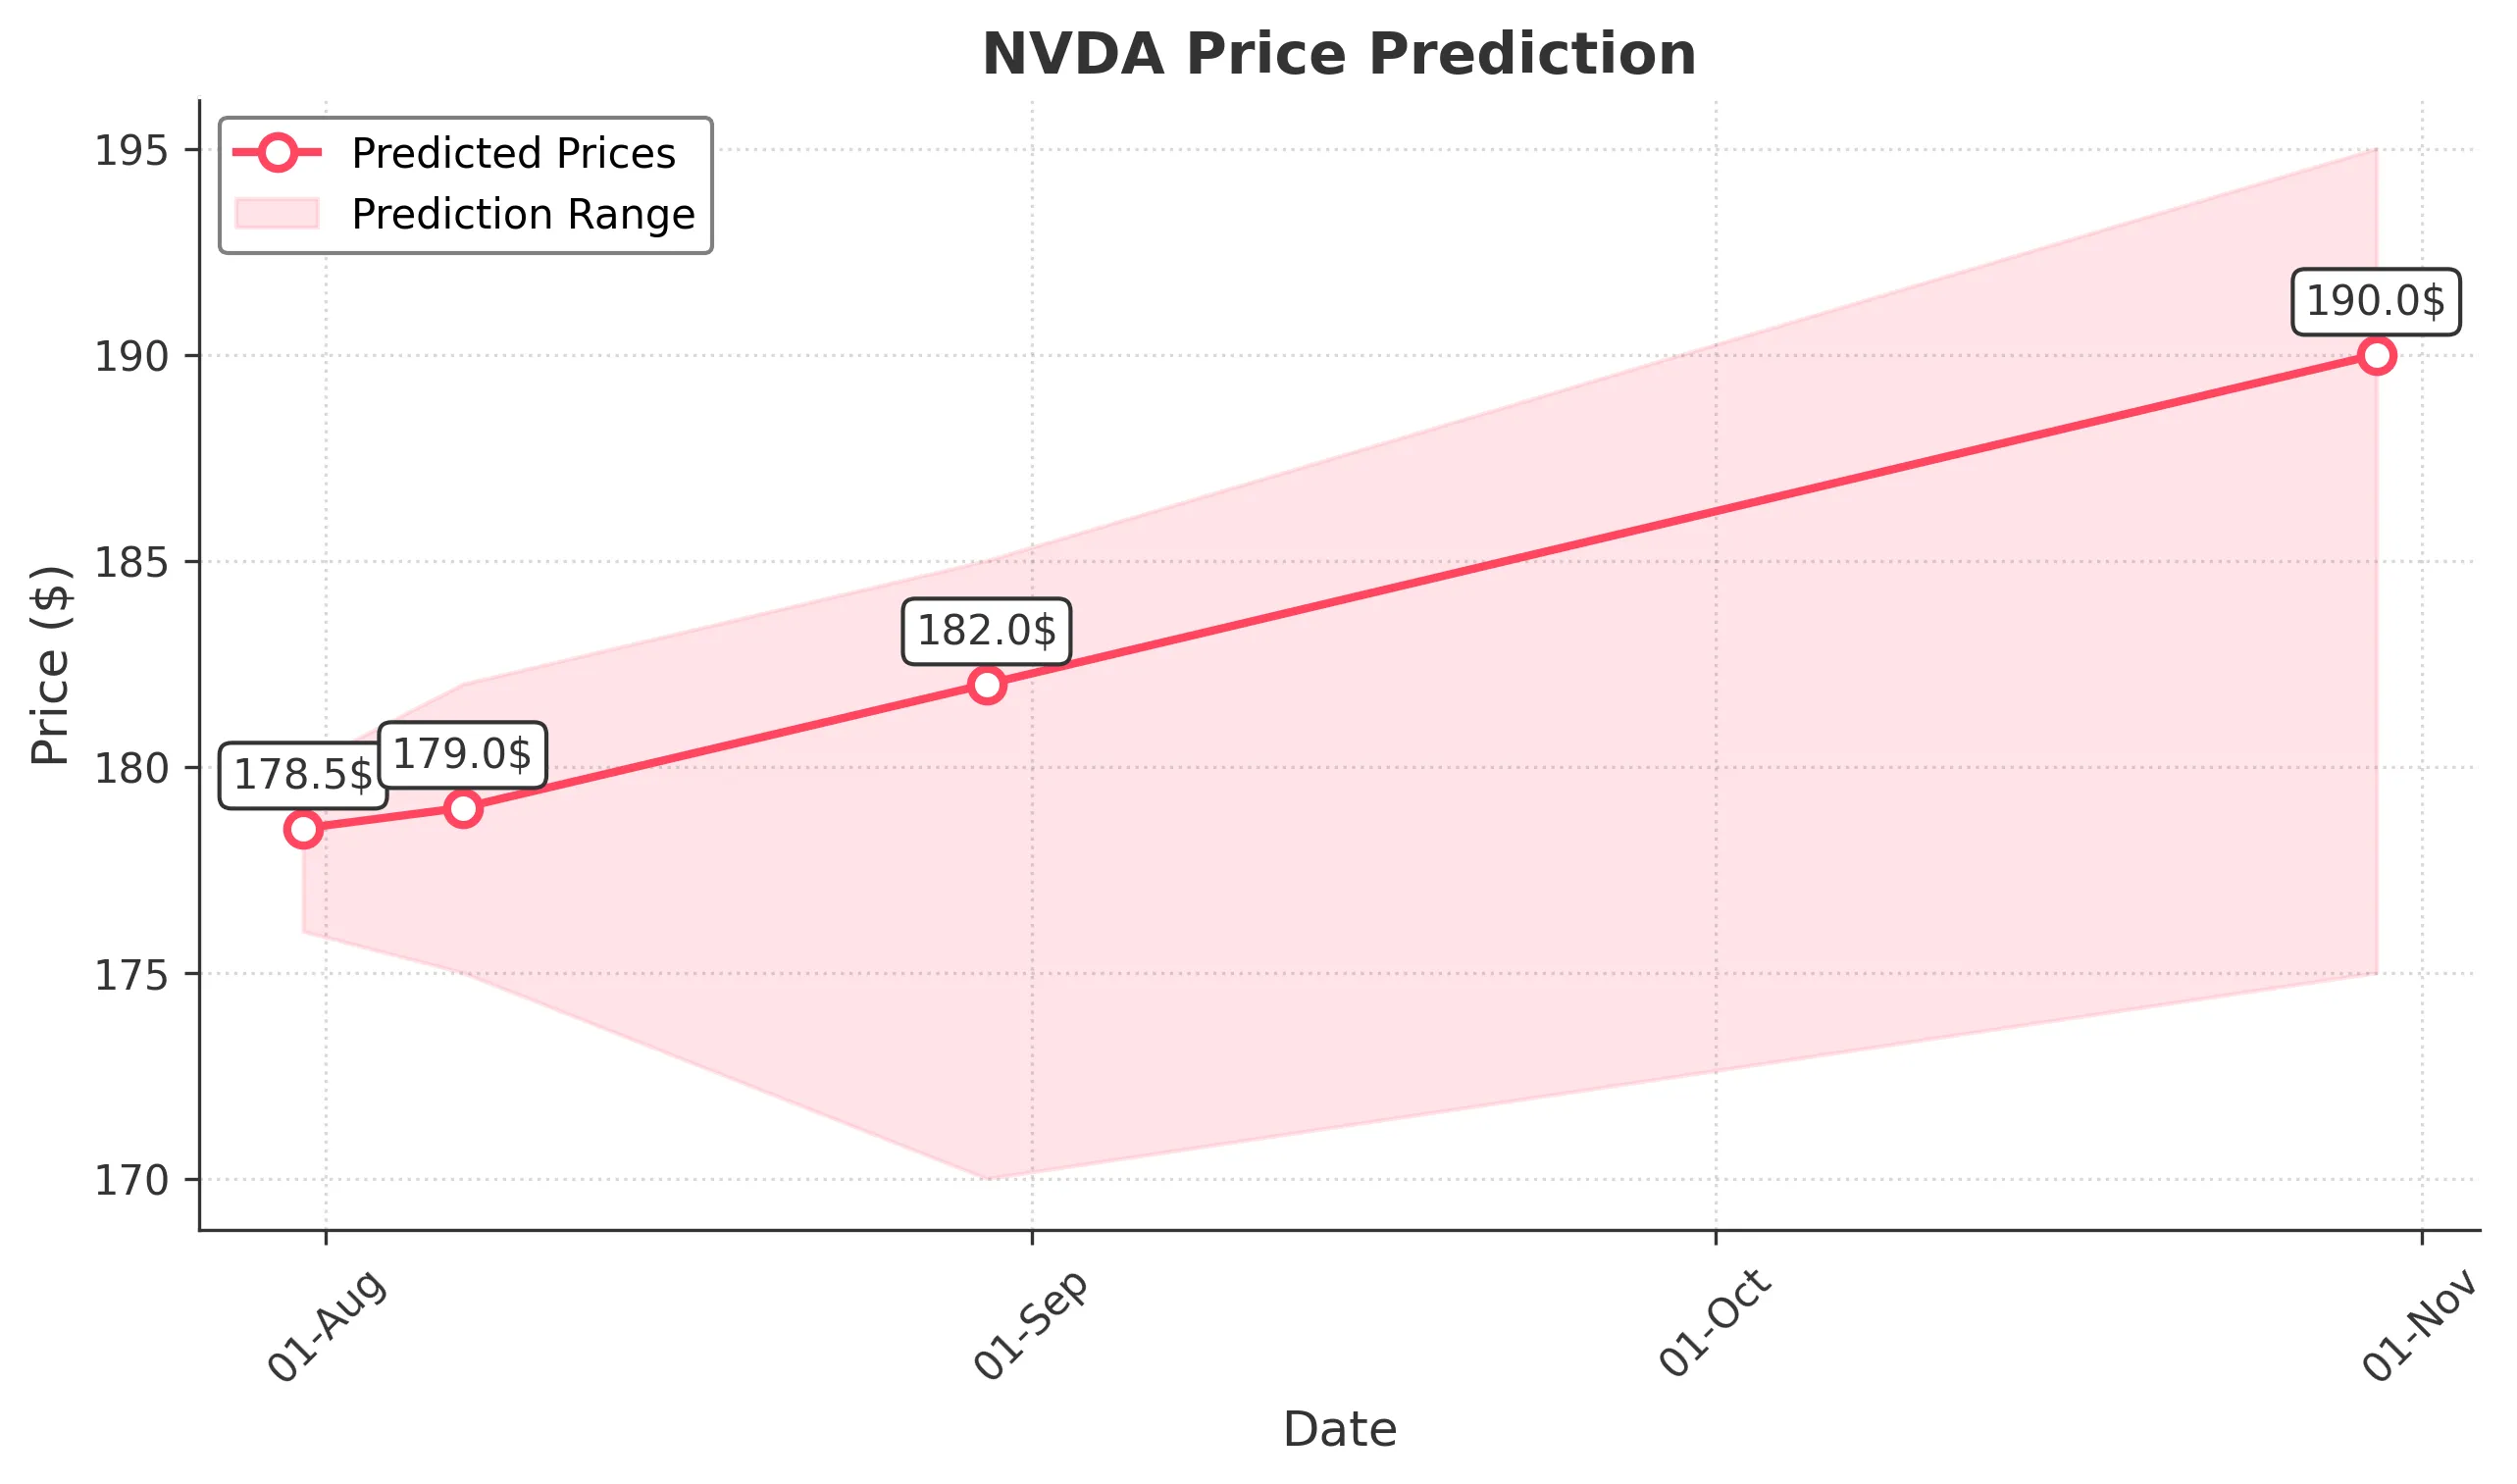
Target: July 31, 2025$178.5
$177.5
$180
$176
Description
The stock shows bullish momentum with a recent upward trend. The RSI is approaching overbought levels, indicating potential for a pullback. However, strong volume suggests continued interest. Watch for resistance at $180.
Analysis
Over the past 3 months, NVDA has shown a bullish trend, with significant support at $170 and resistance around $180. The MACD indicates upward momentum, while the ATR suggests moderate volatility. Recent volume spikes indicate strong buying interest.
Confidence Level
Potential Risks
Potential market volatility and profit-taking could lead to a reversal.
1 Week Prediction
Target: August 7, 2025$179
$178
$182
$175
Description
The stock is expected to maintain its upward trajectory, supported by strong fundamentals. However, the RSI indicates overbought conditions, which may lead to short-term corrections. Key resistance at $182.
Analysis
NVDA has been on a bullish run, with key support at $175. The MACD remains positive, and the Bollinger Bands suggest potential for a breakout. Volume trends indicate strong buying, but caution is advised as the stock approaches overbought territory.
Confidence Level
Potential Risks
Market sentiment could shift due to macroeconomic news, impacting the stock's performance.
1 Month Prediction
Target: August 30, 2025$182
$180
$185
$170
Description
Expect continued bullish momentum, with potential for a breakout above $180. The stock's fundamentals remain strong, but watch for profit-taking as it approaches resistance levels. Market sentiment is generally positive.
Analysis
The stock has shown a strong upward trend, with significant support at $170. The RSI is nearing overbought levels, and the MACD remains bullish. Volume patterns indicate sustained interest, but external factors could impact future performance.
Confidence Level
Potential Risks
Economic indicators and earnings reports could introduce volatility.
3 Months Prediction
Target: October 30, 2025$190
$185
$195
$175
Description
Long-term outlook remains bullish, with potential for further gains as the company continues to innovate. However, macroeconomic factors and market corrections could pose risks. Key resistance at $195.
Analysis
Over the last three months, NVDA has demonstrated a strong bullish trend, with key support at $175. The MACD and RSI suggest continued upward momentum, but the stock is approaching overbought territory. External economic factors could introduce volatility.
Confidence Level
Potential Risks
Unforeseen market events or economic downturns could affect stock performance.