NVDA Trading Predictions
1 Day Prediction
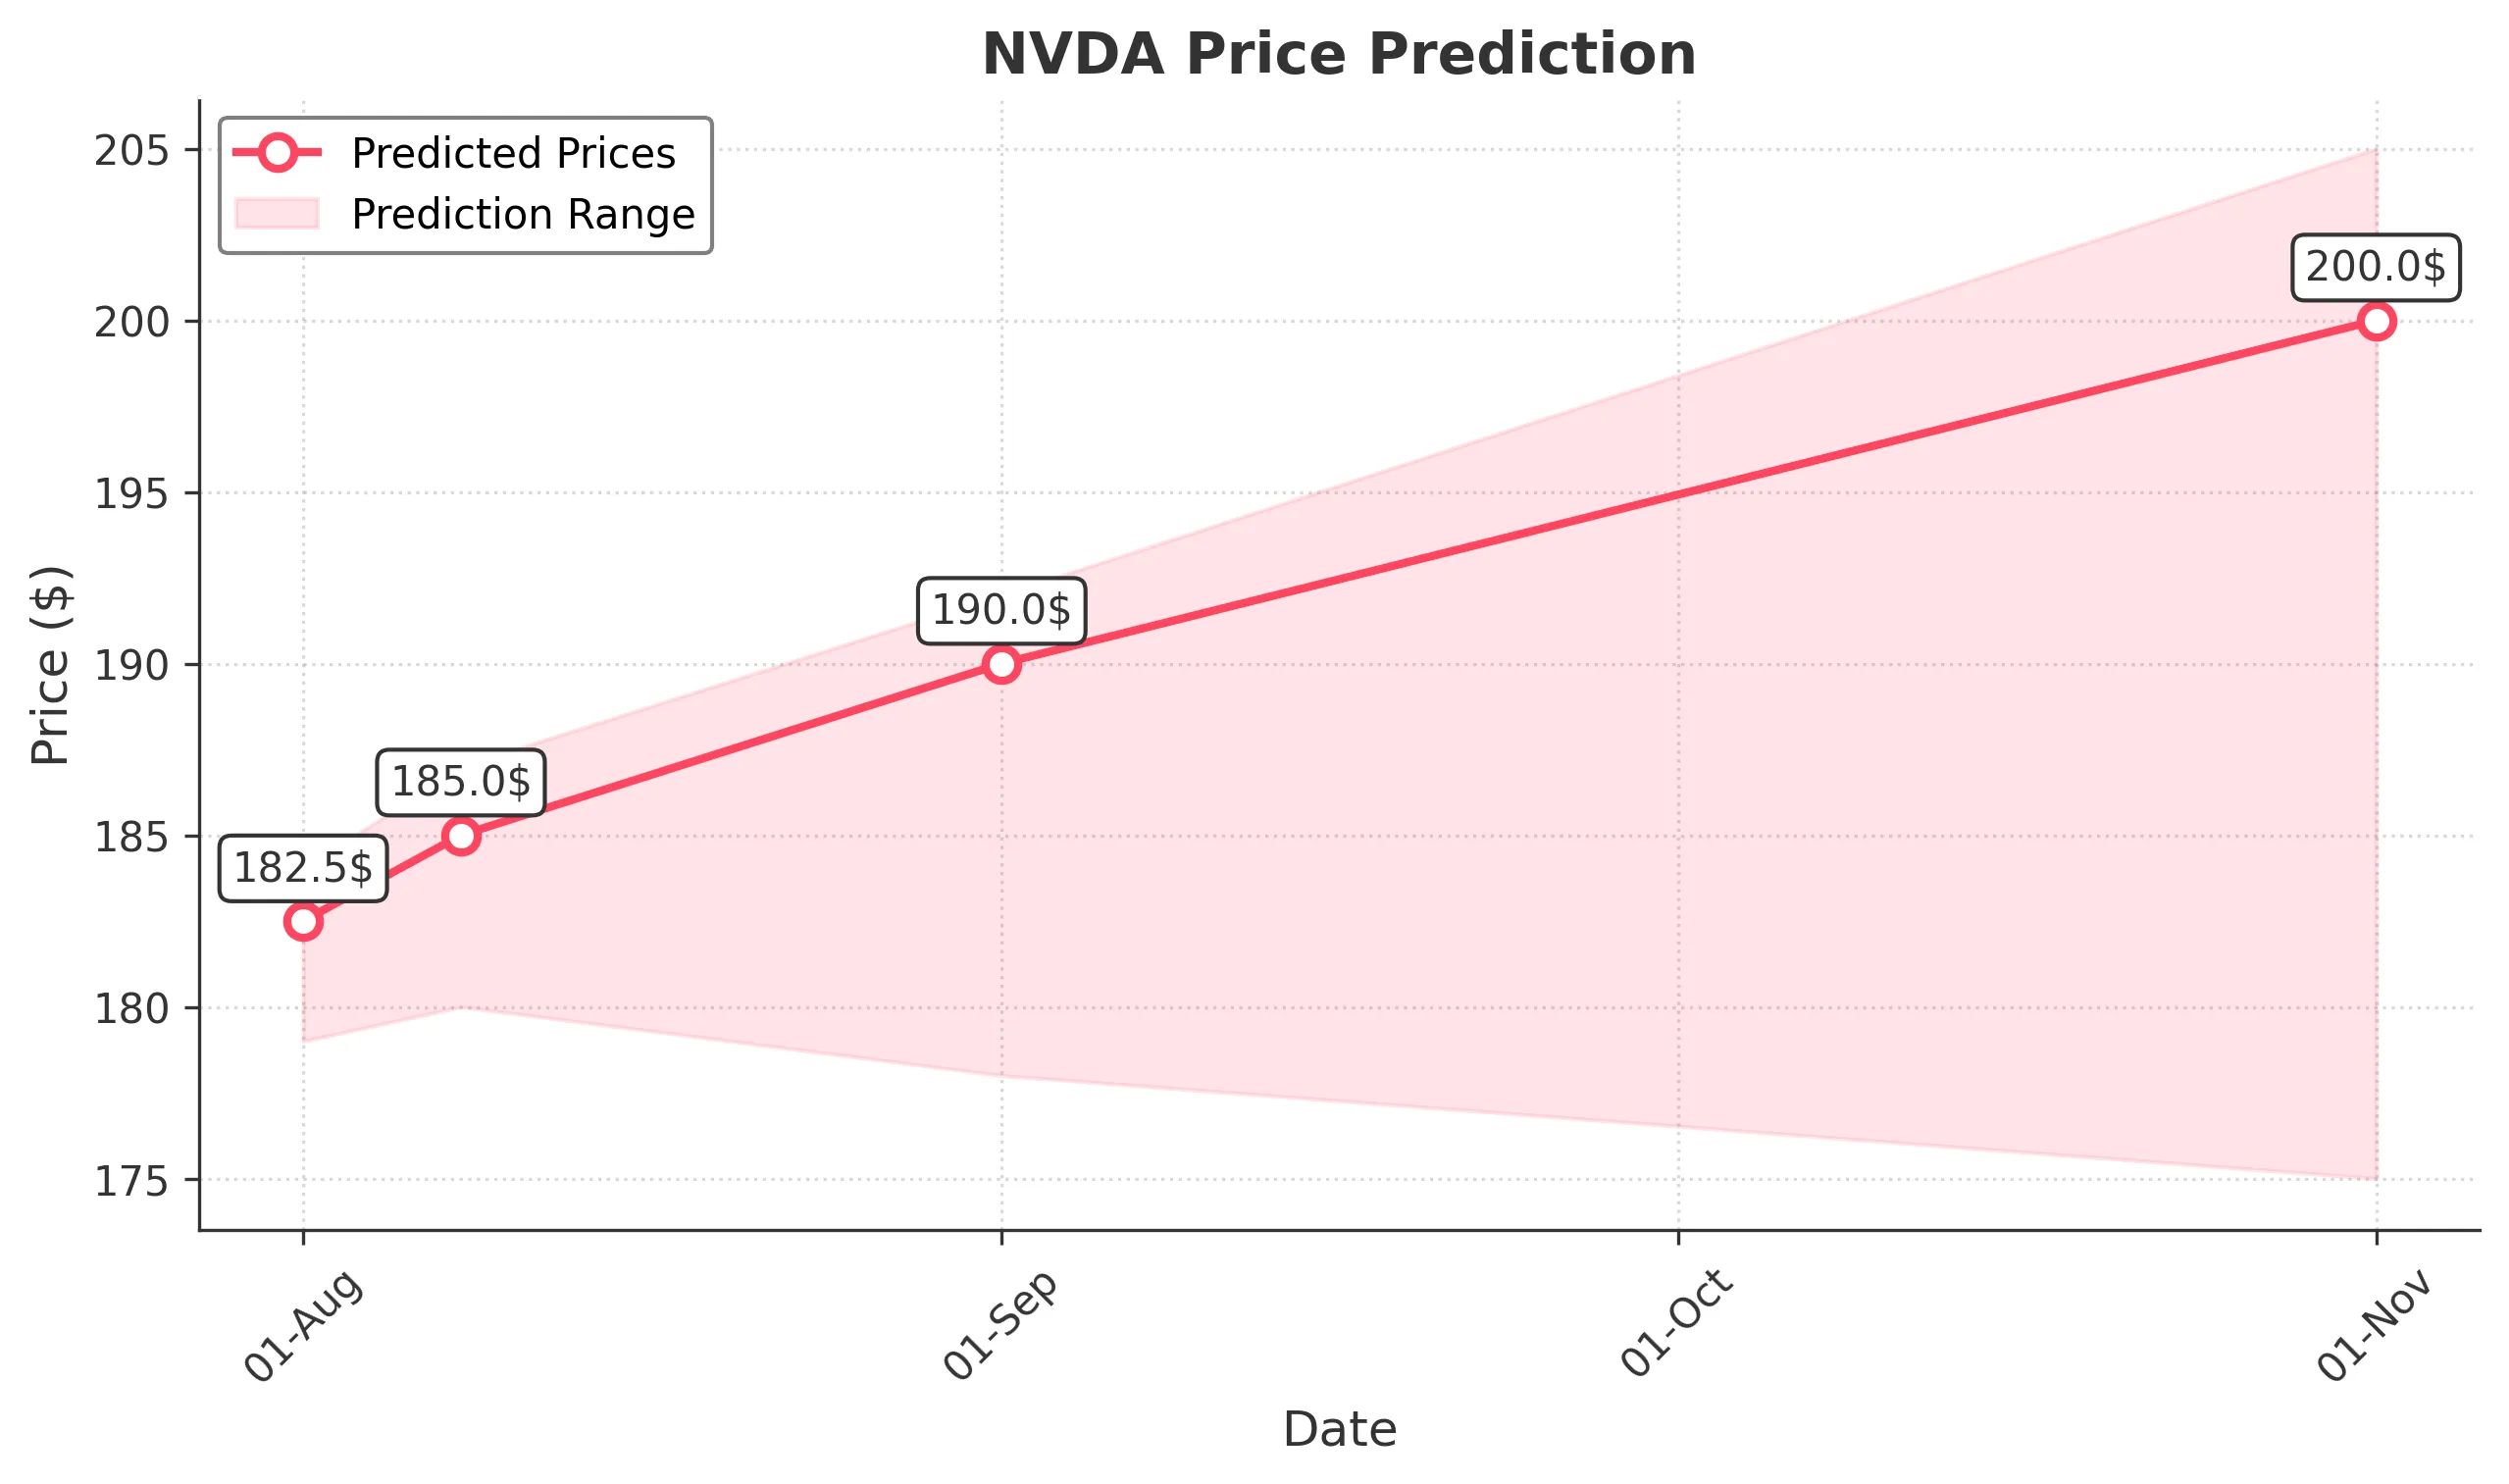
Target: August 1, 2025$182.5
$181.5
$184
$179
Description
The stock shows bullish momentum with a recent upward trend. The RSI is nearing overbought levels, indicating potential for a pullback. However, strong support at $180 and positive market sentiment suggest a slight increase in price.
Analysis
Over the past 3 months, NVDA has shown a strong bullish trend, with significant support at $180. The recent price action indicates a potential continuation of this trend, although RSI suggests caution due to overbought conditions.
Confidence Level
Potential Risks
Potential market volatility and profit-taking could lead to a price drop.
1 Week Prediction
Target: August 8, 2025$185
$182.5
$187
$180
Description
The stock is expected to continue its upward trajectory, supported by strong buying volume and bullish candlestick patterns. However, the MACD indicates a potential slowdown, suggesting a cautious approach.
Analysis
NVDA has maintained a bullish trend with increasing volume. Key resistance at $185 may pose challenges, but overall sentiment remains positive. Watch for potential pullbacks as the stock approaches overbought territory.
Confidence Level
Potential Risks
Market corrections or negative news could impact the price.
1 Month Prediction
Target: September 1, 2025$190
$185
$192
$178
Description
With continued bullish momentum and strong fundamentals, NVDA is likely to reach new highs. Fibonacci retracement levels suggest support at $180, while the MACD remains bullish.
Analysis
The stock has shown consistent upward movement, with key support at $180. The bullish MACD and RSI indicate strong buying interest, but external factors could introduce volatility. Watch for earnings announcements.
Confidence Level
Potential Risks
Economic factors or earnings reports could lead to volatility.
3 Months Prediction
Target: November 1, 2025$200
$190
$205
$175
Description
Long-term bullish sentiment supported by strong fundamentals and market trends. However, potential market corrections and economic uncertainties could impact performance.
Analysis
Over the last three months, NVDA has shown a strong bullish trend, with significant support at $180. While the outlook remains positive, external economic factors and potential market corrections could introduce risks.
Confidence Level
Potential Risks
Macroeconomic events and market sentiment shifts could lead to unexpected price movements.