NVDA Trading Predictions
1 Day Prediction
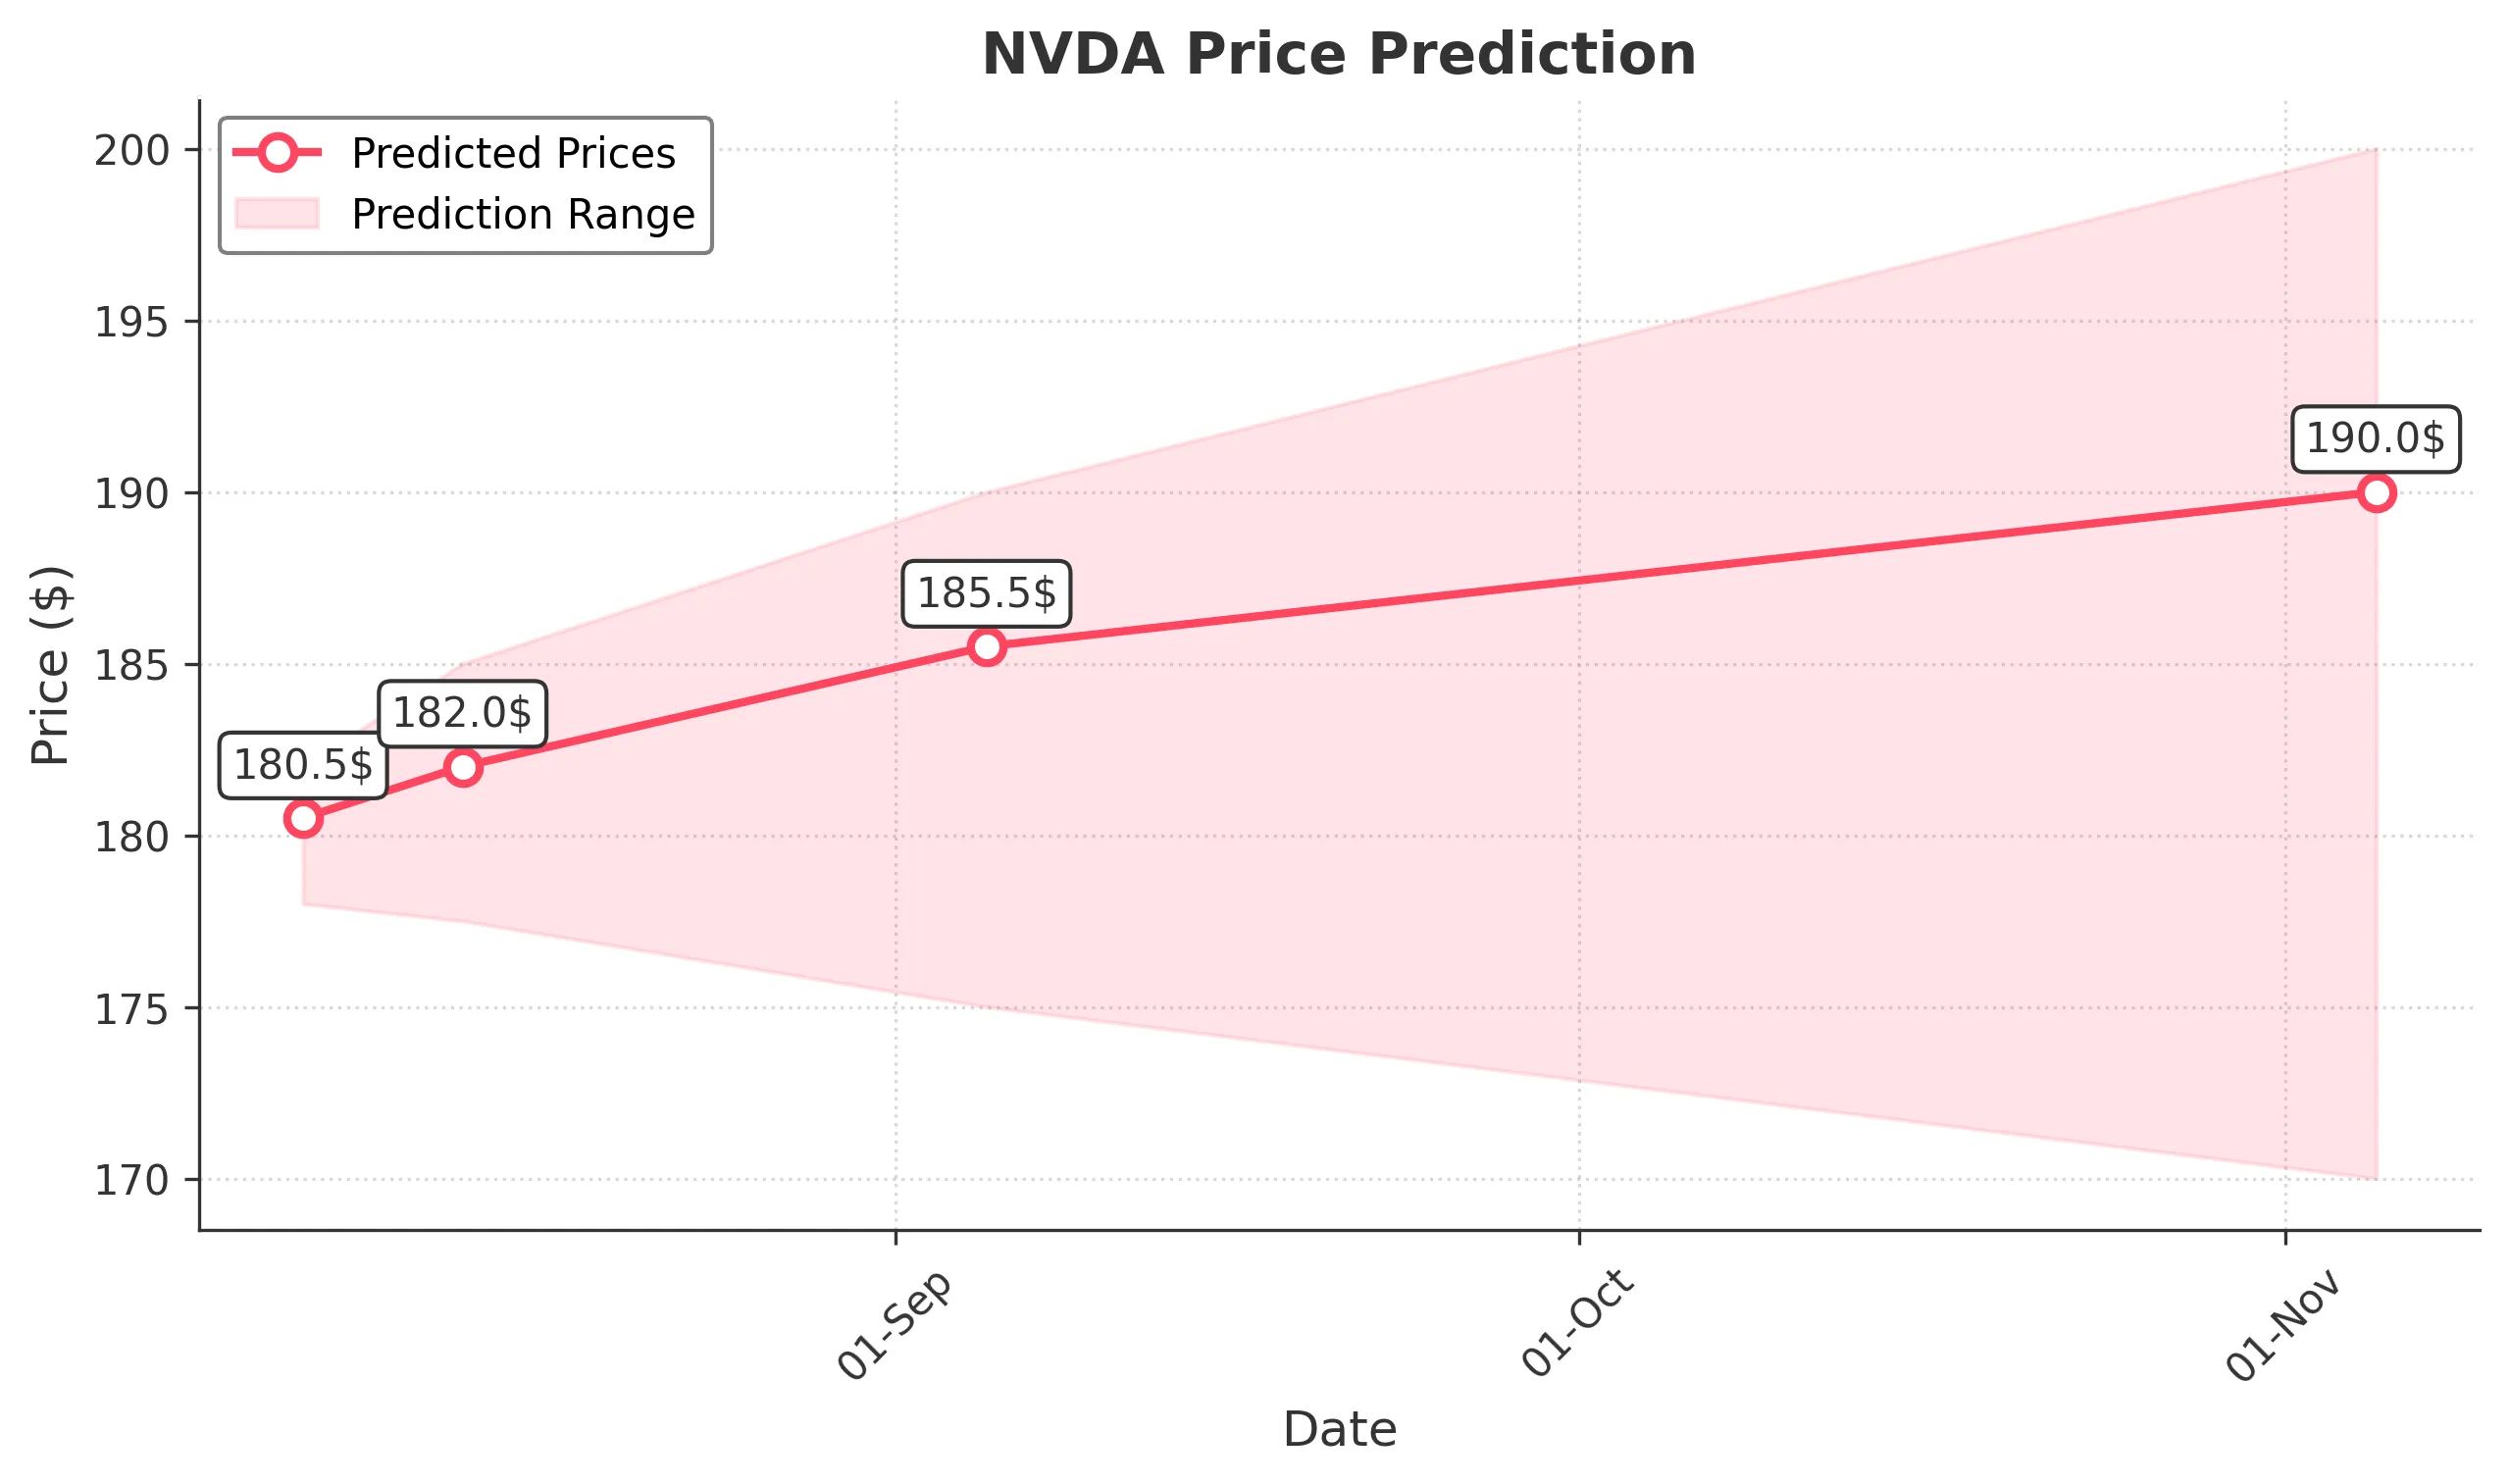
Target: August 6, 2025$180.5
$180.1
$182
$178
Description
The stock shows bullish momentum with a recent close above the 20-day moving average. RSI is nearing overbought territory, indicating potential for a pullback. However, strong volume suggests continued interest. Expect a slight upward movement.
Analysis
Over the past 3 months, NVDA has shown a bullish trend, with significant support at $170 and resistance around $180. The recent price action indicates strong buying interest, but RSI nearing overbought levels suggests caution.
Confidence Level
Potential Risks
Potential for a reversal if market sentiment shifts or if macroeconomic news impacts tech stocks.
1 Week Prediction
Target: August 13, 2025$182
$180.5
$185
$177.5
Description
With the stock maintaining above key support levels and bullish candlestick patterns forming, a continued upward trend is expected. However, the MACD shows signs of potential divergence, indicating caution.
Analysis
The stock has been in a bullish phase, with strong volume spikes indicating investor confidence. Key resistance at $185 may pose challenges, while support at $177.50 remains critical.
Confidence Level
Potential Risks
Market volatility and external economic factors could lead to unexpected price movements.
1 Month Prediction
Target: September 5, 2025$185.5
$182
$190
$175
Description
The stock is expected to continue its upward trajectory, supported by strong fundamentals and positive market sentiment. However, the RSI indicates potential overbought conditions, suggesting a possible correction.
Analysis
NVDA has shown resilience with a bullish trend, but the market's reaction to macroeconomic events could introduce volatility. Key support at $175 and resistance at $190 are critical levels to watch.
Confidence Level
Potential Risks
Economic data releases and earnings reports could impact stock performance significantly.
3 Months Prediction
Target: November 5, 2025$190
$185
$200
$170
Description
Long-term bullish sentiment remains, driven by strong demand in the tech sector. However, potential economic headwinds and profit-taking could lead to volatility. Watch for key earnings reports.
Analysis
The stock has been on a bullish run, but the potential for market corrections exists. Key support at $170 and resistance at $200 will be crucial in determining the stock's trajectory over the next few months.
Confidence Level
Potential Risks
Unforeseen market events or shifts in investor sentiment could lead to significant price fluctuations.