NVDA Trading Predictions
1 Day Prediction
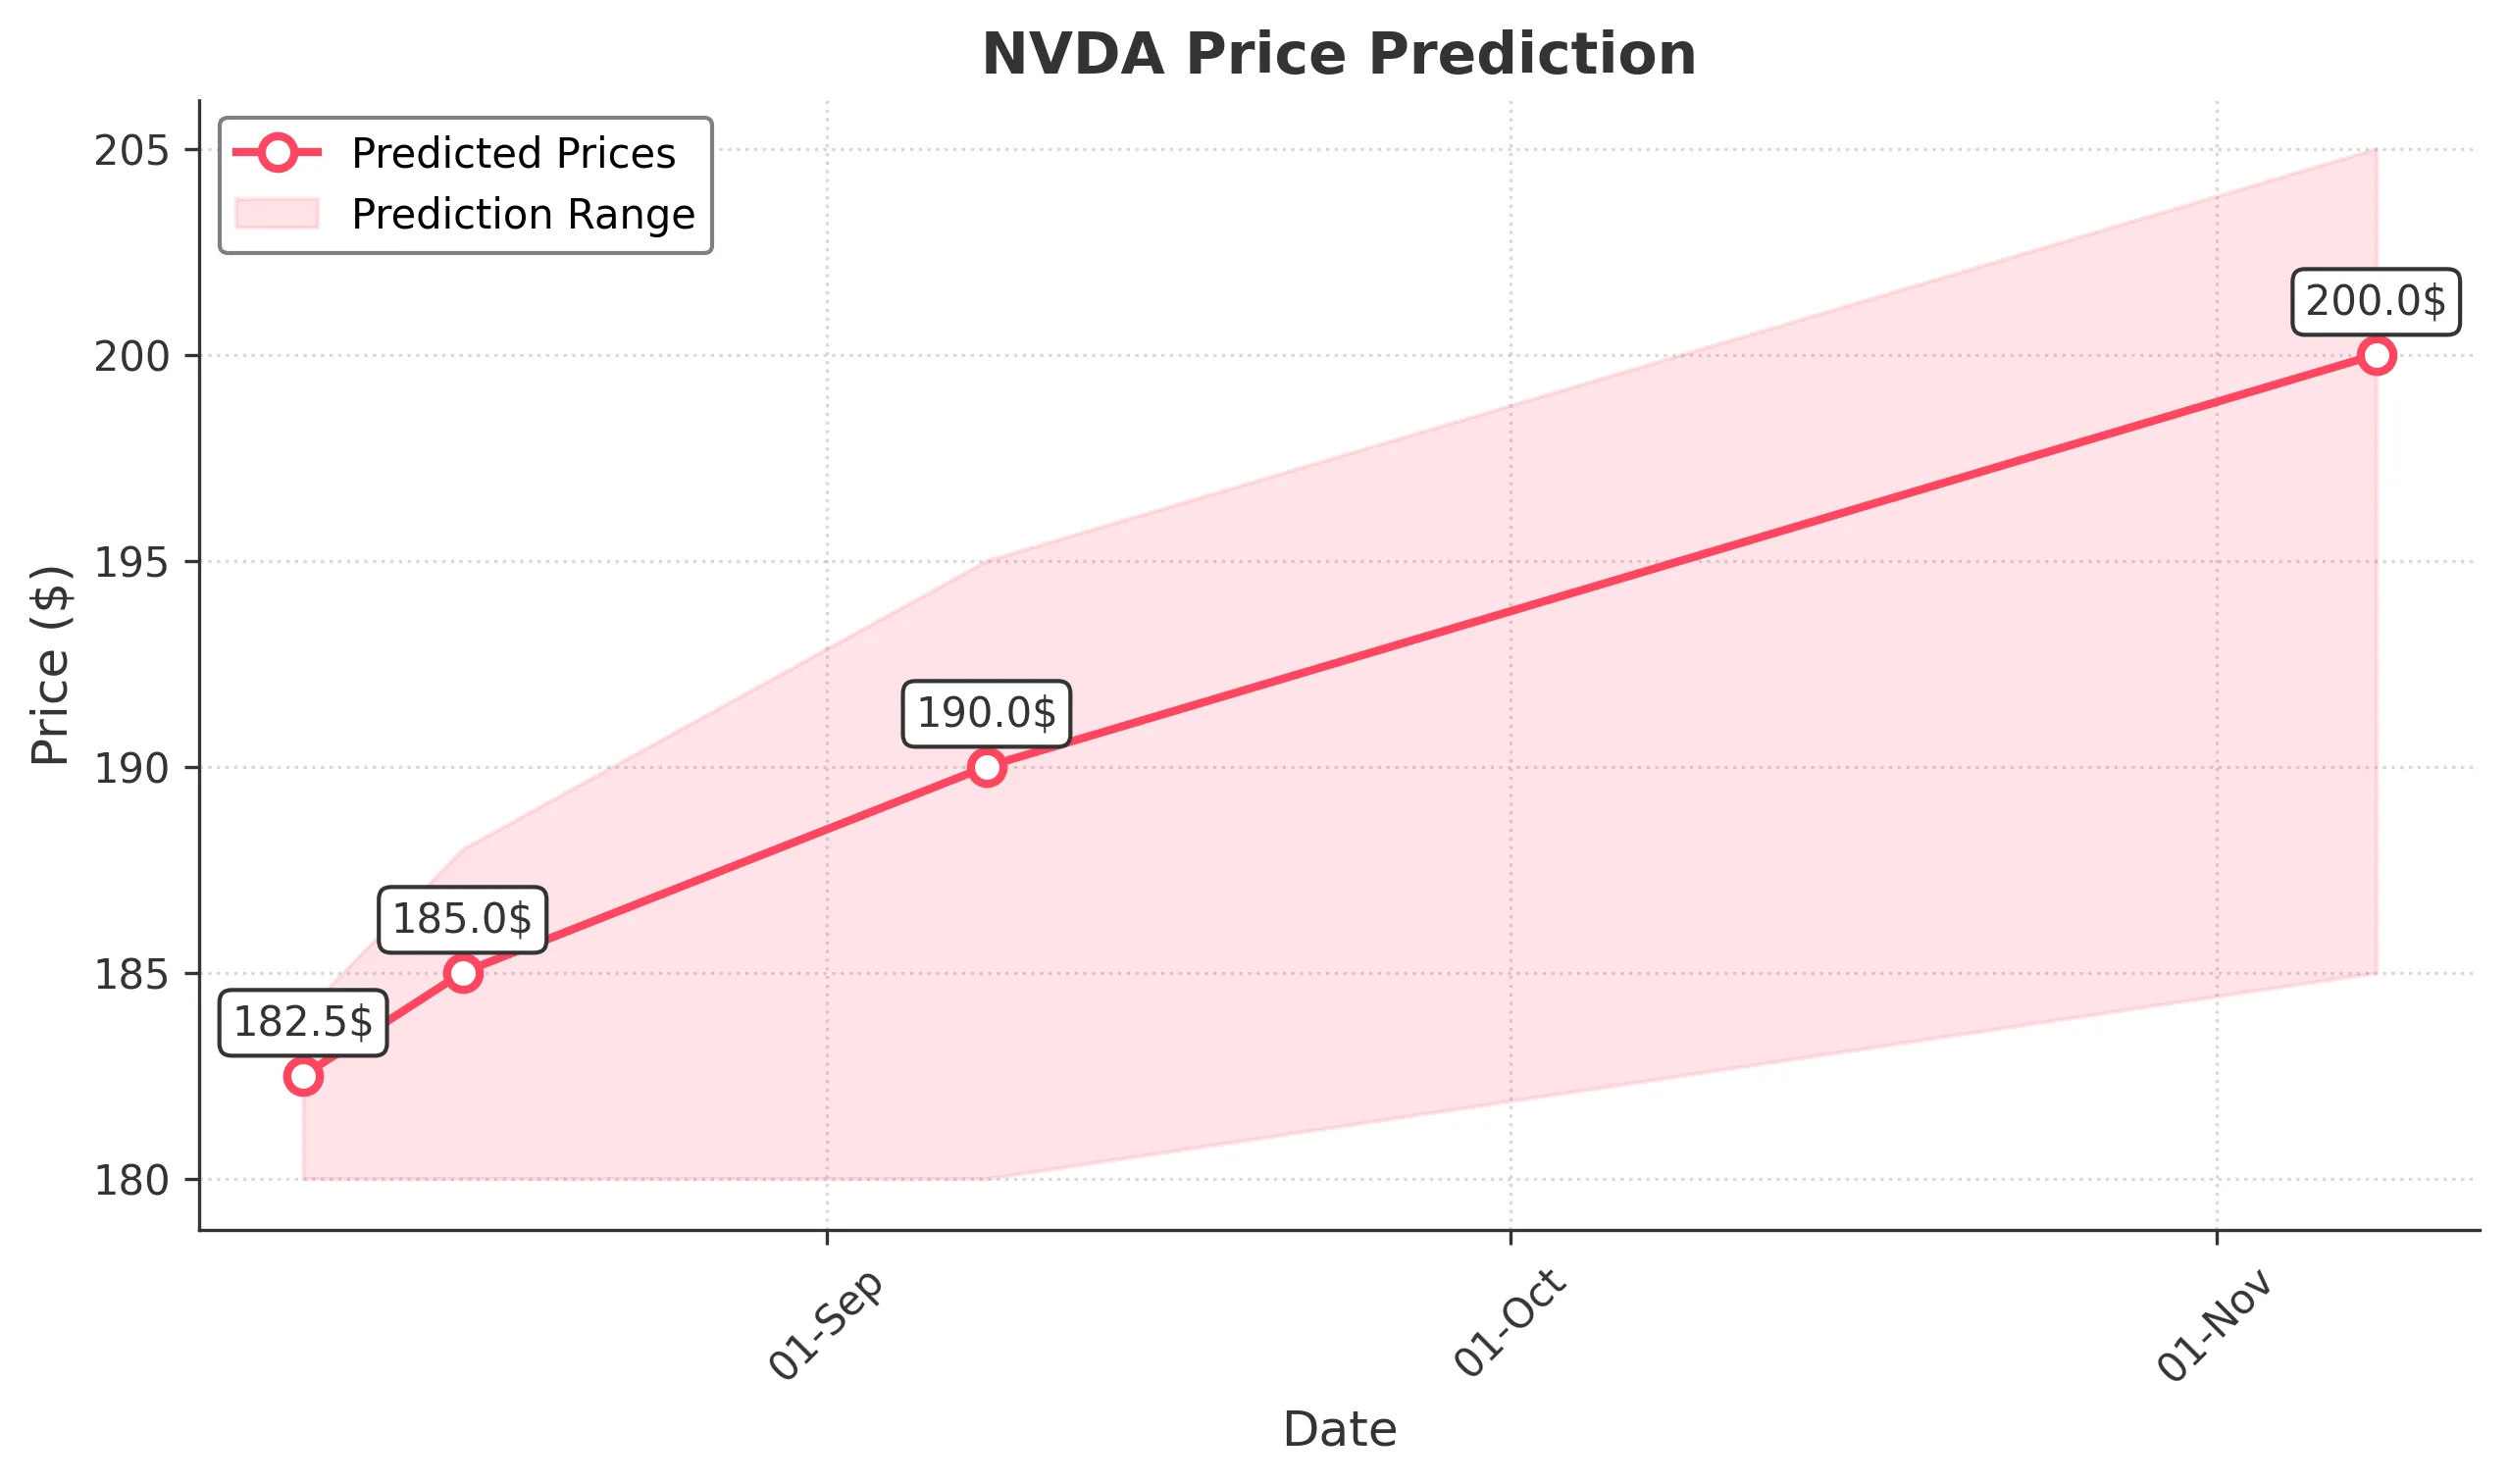
Target: August 9, 2025$182.5
$181.8
$184
$180
Description
The stock shows bullish momentum with a recent upward trend. The RSI is nearing overbought levels, indicating potential for a pullback. However, strong buying volume suggests continued interest. Expect a close around 182.50.
Analysis
Over the past 3 months, NVDA has shown a bullish trend, with significant support at $170 and resistance around $185. The recent price action indicates strong buying interest, but the RSI suggests caution as it approaches overbought territory.
Confidence Level
Potential Risks
Potential for a pullback due to overbought RSI; market sentiment could shift quickly.
1 Week Prediction
Target: August 16, 2025$185
$182.5
$188
$180
Description
The bullish trend is expected to continue, with strong support at $180. The MACD shows a bullish crossover, and volume remains robust. Anticipate a close around $185 as momentum builds.
Analysis
NVDA has maintained a bullish trend, with key support at $180 and resistance at $188. The MACD indicates bullish momentum, but the market's overall sentiment and potential macroeconomic events could introduce volatility.
Confidence Level
Potential Risks
Market volatility and external factors could impact momentum; watch for any bearish signals.
1 Month Prediction
Target: September 8, 2025$190
$185
$195
$180
Description
Expect continued bullish momentum as NVDA approaches key Fibonacci retracement levels. The market sentiment remains positive, but watch for potential resistance at $195.
Analysis
The stock has shown a strong upward trajectory, with significant support at $180. The Fibonacci levels suggest potential resistance around $195. While the trend is bullish, external economic factors could introduce volatility.
Confidence Level
Potential Risks
Potential market corrections and external economic factors could affect the upward trend.
3 Months Prediction
Target: November 8, 2025$200
$190
$205
$185
Description
Long-term bullish outlook as NVDA continues to capitalize on market trends. However, watch for potential corrections as the stock approaches $205 resistance.
Analysis
Over the past three months, NVDA has shown a strong bullish trend, with key support at $180 and resistance at $205. The overall market sentiment is positive, but potential economic shifts could introduce volatility and corrections.
Confidence Level
Potential Risks
Market corrections and economic shifts could impact the stock's performance; remain cautious.