NVDA Trading Predictions
1 Day Prediction
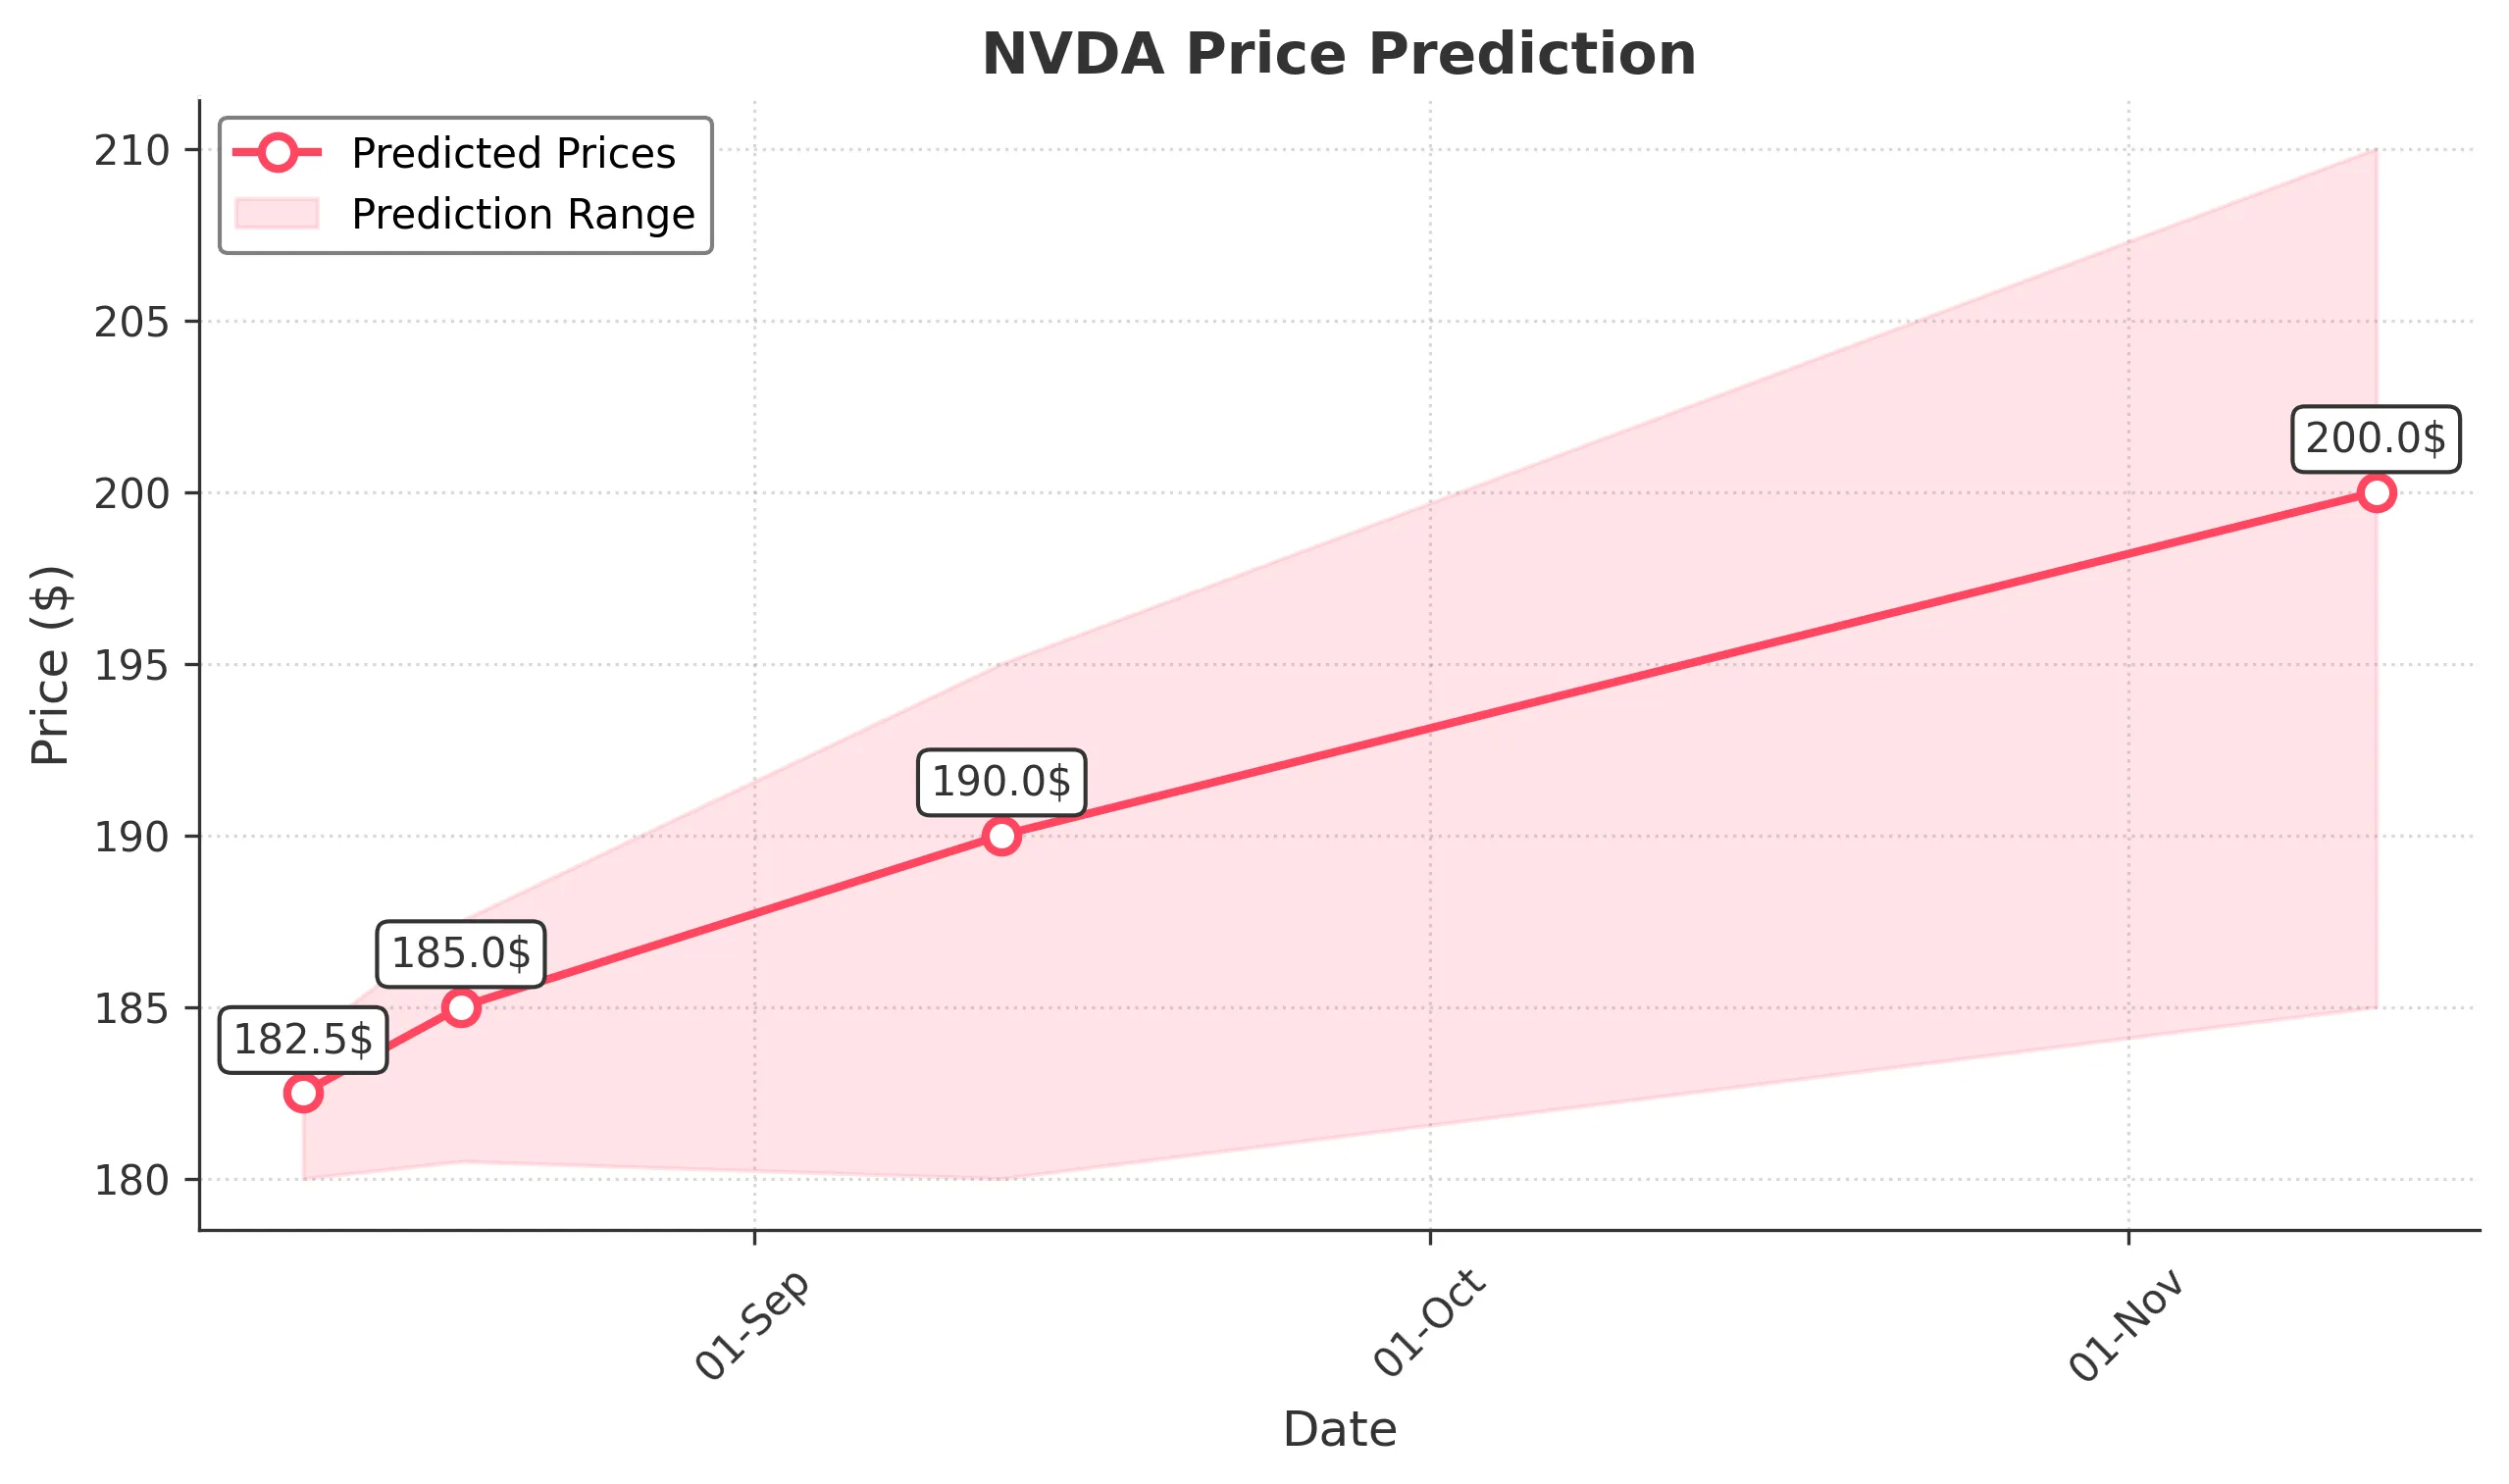
Target: August 12, 2025$182.5
$181.5
$184
$180
Description
The stock shows a bullish trend with a recent Doji pattern indicating indecision. RSI is near 60, suggesting upward momentum. However, MACD is flattening, indicating potential consolidation. Volume remains steady, supporting the price action.
Analysis
Over the past 3 months, NVDA has shown a bullish trend with significant upward movements. Key support is at $170, while resistance is around $185. The RSI indicates strength, but MACD divergence suggests caution. Volume spikes on up days indicate strong buying interest.
Confidence Level
Potential Risks
Potential market volatility and external news could impact the price. A reversal is possible if bearish sentiment emerges.
1 Week Prediction
Target: August 19, 2025$185
$182.5
$187.5
$180.5
Description
The bullish trend is expected to continue, supported by a recent breakout above resistance. The MACD is bullish, and the RSI is still healthy. However, a pullback could occur if profit-taking happens after the recent gains.
Analysis
NVDA has maintained a strong upward trajectory, with key support at $180. The recent price action shows bullish candlestick patterns, and the ATR indicates moderate volatility. External factors, such as tech sector performance, could influence future movements.
Confidence Level
Potential Risks
Market sentiment can shift quickly, and any negative news could lead to a price drop. Watch for volume changes that may indicate a reversal.
1 Month Prediction
Target: September 12, 2025$190
$185
$195
$180
Description
The stock is likely to reach new highs as it approaches key Fibonacci retracement levels. The bullish momentum is supported by strong earnings expectations. However, overbought conditions may lead to a correction.
Analysis
In the last three months, NVDA has shown significant growth, with a clear bullish trend. Key resistance is at $195, while support is at $180. The RSI is approaching overbought territory, indicating a potential pullback. Volume trends suggest strong interest, but caution is warranted.
Confidence Level
Potential Risks
Economic indicators and earnings reports could impact the stock's performance. A sudden market downturn could also affect the bullish outlook.
3 Months Prediction
Target: November 12, 2025$200
$195
$210
$185
Description
Long-term bullish sentiment is expected as NVDA continues to innovate and capture market share. However, potential macroeconomic headwinds could create volatility. Watch for earnings reports that may influence sentiment.
Analysis
NVDA has shown a strong upward trend over the past three months, with significant support at $185 and resistance at $210. The stock's performance is influenced by broader market trends and tech sector dynamics. The MACD indicates bullish momentum, but caution is advised due to potential market corrections.
Confidence Level
Potential Risks
Macroeconomic factors, such as interest rates and inflation, could impact the stock's performance. Additionally, competitive pressures in the tech sector may pose risks.